|
Download Data (XLS File) |
|
||||||||
|
||||||||
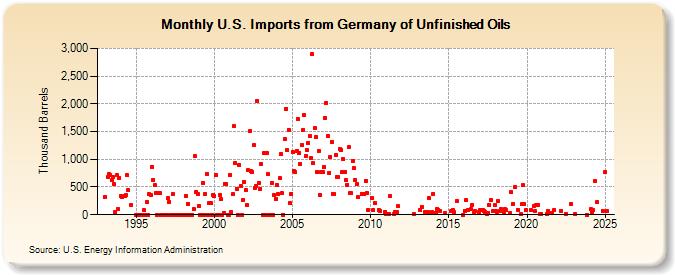
| U.S. Imports from Germany of Unfinished Oils (Thousand Barrels) | ||||||||
| Year | Jan | Feb | Mar | Apr | May | Jun | Jul | Aug | Sep | Oct | Nov | Dec |
|---|---|---|---|---|---|---|---|---|---|---|---|---|
| 1993 | 319 | 678 | 735 | 708 | 618 | 676 | 552 | 50 | 712 | 107 | 664 | |
| 1994 | 336 | 326 | 345 | 349 | 709 | 442 | 178 | |||||
| 1995 | 0 | 0 | 0 | 0 | 0 | 0 | 78 | 0 | 230 | 0 | 370 | 356 |
| 1996 | 865 | 622 | 529 | 389 | 0 | 396 | 395 | 0 | 0 | 0 | 0 | 0 |
| 1997 | 299 | 231 | 0 | 0 | 373 | 0 | 0 | 0 | 0 | 0 | 0 | 0 |
| 1998 | 0 | 0 | 345 | 0 | 195 | 0 | 0 | 0 | 101 | 1,053 | 410 | 373 |
| 1999 | 156 | 0 | 0 | 577 | 0 | 378 | 737 | 0 | 220 | 204 | 0 | 362 |
| 2000 | 337 | 711 | 0 | 0 | 360 | 277 | 0 | 39 | 551 | 550 | 0 | 0 |
| 2001 | 722 | 46 | 369 | 1,594 | 937 | 472 | 0 | 900 | 520 | 0 | 271 | 594 |
| 2002 | 445 | 175 | 800 | 1,502 | 780 | 774 | 1,252 | 481 | 526 | 2,049 | 571 | 461 |
| 2003 | 911 | 0 | 1,110 | 0 | 1,119 | 728 | 0 | 0 | 576 | 0 | 350 | 290 |
| 2004 | 543 | 373 | 656 | 1,091 | 383 | 0 | 1,369 | 1,913 | 1,161 | 1,535 | 208 | 380 |
| 2005 | 1,135 | 791 | 765 | 1,152 | 1,729 | 1,120 | 916 | 1,266 | 1,530 | 1,793 | 1,059 | 1,164 |
| 2006 | 1,297 | 1,417 | 1,027 | 2,897 | 924 | 1,560 | 1,408 | 766 | 1,155 | 353 | 777 | 769 |
| 2007 | 859 | 1,744 | 2,013 | 1,422 | 758 | 1,043 | 1,308 | 382 | 372 | 1,078 | 688 | 673 |
| 2008 | 1,187 | 1,173 | 767 | 1,003 | 772 | 619 | 541 | 1,216 | 385 | 387 | 977 | 845 |
| 2009 | 624 | 545 | 317 | 382 | 381 | 382 | 614 | 392 | 85 | |||
| 2010 | 304 | 87 | 215 | 88 | 76 | 54 | ||||||
| 2011 | 19 | 17 | 329 | 12 | 40 | 43 | 149 | |||||
| 2012 | 14 | |||||||||||
| 2013 | 78 | 146 | 51 | 44 | 296 | 52 | ||||||
| 2014 | 378 | 24 | 29 | 106 | 90 | 63 | 24 | |||||
| 2015 | 71 | 94 | 45 | 243 | 1 | |||||||
| 2016 | 73 | 260 | 82 | 99 | 174 | 35 | 60 | 48 | ||||
| 2017 | 87 | 79 | 73 | 55 | 20 | 27 | 176 | 257 | 63 | 173 | ||
| 2018 | 63 | 48 | 246 | 75 | 98 | 32 | 100 | 83 | 25 | |||
| 2019 | 405 | 197 | 499 | 87 | 6 | 186 | 535 | 186 | 82 | |||
| 2020 | 85 | 156 | 59 | 167 | 172 | 14 | 19 | |||||
| 2021 | 11 | 73 | 34 | 30 | 24 | 87 | ||||||
| 2022 | 69 | 14 | 195 | |||||||||
| 2023 | 9 | 3 | ||||||||||
| - = No Data Reported; -- = Not Applicable; NA = Not Available; W = Withheld to avoid disclosure of individual company data. |
| Release Date: 3/29/2024 |
| Next Release Date: 4/30/2024 |