|
Download Data (XLS File) |
|
||||||||
|
||||||||
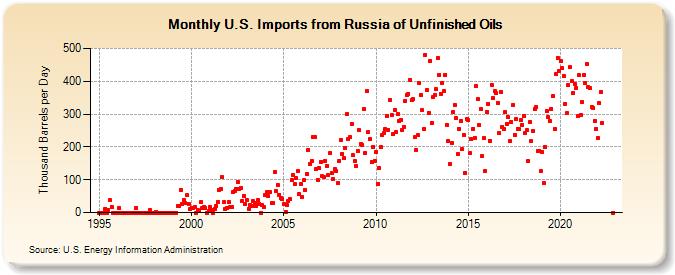
| U.S. Imports from Russia of Unfinished Oils (Thousand Barrels per Day) | ||||||||
| Year | Jan | Feb | Mar | Apr | May | Jun | Jul | Aug | Sep | Oct | Nov | Dec |
|---|---|---|---|---|---|---|---|---|---|---|---|---|
| 1995 | 0 | 0 | 0 | 0 | 12 | 0 | 8 | 37 | 18 | 0 | 0 | 0 |
| 1996 | 0 | 14 | 0 | 0 | 0 | 0 | 0 | 0 | 0 | 0 | 0 | 0 |
| 1997 | 14 | 0 | 0 | 0 | 0 | 0 | 0 | 0 | 0 | 7 | 0 | 0 |
| 1998 | 0 | 3 | 0 | 0 | 0 | 0 | 0 | 0 | 0 | 0 | 0 | 0 |
| 1999 | 0 | 0 | 0 | 21 | 21 | 68 | 27 | 38 | 29 | 52 | 27 | 11 |
| 2000 | 15 | 15 | 17 | 0 | 8 | 6 | 31 | 14 | 16 | 14 | 0 | 5 |
| 2001 | 16 | 9 | 0 | 12 | 19 | 32 | 70 | 71 | 108 | 31 | 12 | 14 |
| 2002 | 32 | 16 | 18 | 62 | 66 | 73 | 93 | 72 | 76 | 36 | 51 | 26 |
| 2003 | 38 | 12 | 24 | 21 | 34 | 30 | 21 | 38 | 27 | 0 | 23 | 17 |
| 2004 | 52 | 62 | 50 | 62 | 29 | 28 | 124 | 65 | 83 | 55 | 44 | 42 |
| 2005 | 25 | 3 | 22 | 34 | 40 | 99 | 114 | 86 | 105 | 126 | 56 | 86 |
| 2006 | 48 | 98 | 68 | 118 | 192 | 148 | 158 | 231 | 230 | 133 | 100 | 136 |
| 2007 | 155 | 111 | 108 | 157 | 143 | 113 | 181 | 121 | 102 | 132 | 128 | 89 |
| 2008 | 158 | 222 | 179 | 165 | 197 | 300 | 224 | 229 | 270 | 174 | 157 | 142 |
| 2009 | 188 | 250 | 210 | 207 | 316 | 181 | 370 | 244 | 224 | 154 | 201 | 158 |
| 2010 | 183 | 88 | 136 | 199 | 237 | 242 | 255 | 295 | 252 | 344 | 296 | 239 |
| 2011 | 313 | 246 | 300 | 279 | 283 | 252 | 262 | 341 | 357 | 362 | 405 | 342 |
| 2012 | 345 | 229 | 191 | 235 | 396 | 359 | 311 | 255 | 481 | 374 | 304 | 463 |
| 2013 | 274 | 351 | 357 | 375 | 472 | 420 | 362 | 396 | 369 | 419 | 267 | 218 |
| 2014 | 148 | 213 | 305 | 327 | 287 | 179 | 256 | 280 | 193 | 237 | 122 | 285 |
| 2015 | 281 | 180 | 223 | 256 | 228 | 386 | 345 | 266 | 315 | 171 | 226 | 127 |
| 2016 | 307 | 331 | 219 | 390 | 348 | 369 | 363 | 335 | 241 | 368 | 262 | 254 |
| 2017 | 306 | 271 | 290 | 217 | 276 | 328 | 237 | 284 | 256 | 253 | 283 | 268 |
| 2018 | 295 | 242 | 250 | 156 | 277 | 217 | 249 | 315 | 322 | 188 | 186 | 126 |
| 2019 | 184 | 90 | 199 | 308 | 290 | 279 | 316 | 354 | 254 | 421 | 472 | 432 |
| 2020 | 461 | 439 | 417 | 332 | 302 | 388 | 442 | 400 | 364 | 393 | 378 | 293 |
| 2021 | 418 | 298 | 337 | 419 | 396 | 452 | 383 | 378 | 322 | 317 | 280 | 256 |
| 2022 | 228 | 333 | 367 | 274 | 0 | |||||||
| - = No Data Reported; -- = Not Applicable; NA = Not Available; W = Withheld to avoid disclosure of individual company data. |
| Release Date: 6/28/2024 |
| Next Release Date: 7/31/2024 |