|
Download Data (XLS File) |
|
||||||||
|
||||||||
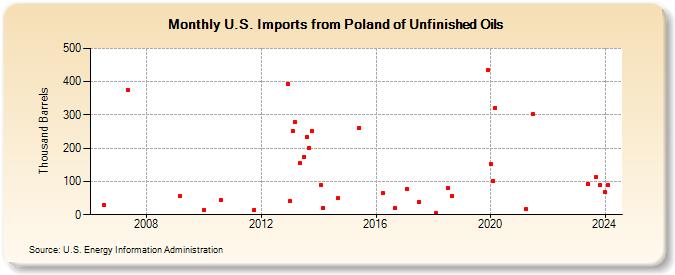
| U.S. Imports from Poland of Unfinished Oils (Thousand Barrels) | ||||||||
| Year | Jan | Feb | Mar | Apr | May | Jun | Jul | Aug | Sep | Oct | Nov | Dec |
|---|---|---|---|---|---|---|---|---|---|---|---|---|
| 2006 | 29 | |||||||||||
| 2007 | 376 | |||||||||||
| 2009 | 55 | |||||||||||
| 2010 | 14 | 43 | ||||||||||
| 2011 | 15 | |||||||||||
| 2012 | 394 | |||||||||||
| 2013 | 40 | 253 | 279 | 155 | 175 | 235 | 202 | 252 | ||||
| 2014 | 90 | 21 | 49 | |||||||||
| 2015 | 262 | |||||||||||
| 2016 | 64 | 20 | ||||||||||
| 2017 | 77 | 38 | ||||||||||
| 2018 | 4 | 79 | 57 | |||||||||
| 2019 | 434 | |||||||||||
| 2020 | 152 | 101 | 321 | |||||||||
| 2021 | 16 | 302 | ||||||||||
| 2023 | 93 | 114 | 90 | |||||||||
| 2024 | 67 | |||||||||||
| - = No Data Reported; -- = Not Applicable; NA = Not Available; W = Withheld to avoid disclosure of individual company data. |
| Release Date: 3/29/2024 |
| Next Release Date: 4/30/2024 |