|
Download Data (XLS File) |
|
||||||||
|
||||||||
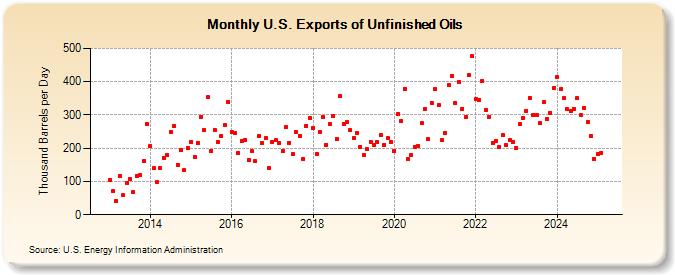
| U.S. Exports of Unfinished Oils (Thousand Barrels per Day) | ||||||||
| Year | Jan | Feb | Mar | Apr | May | Jun | Jul | Aug | Sep | Oct | Nov | Dec |
|---|---|---|---|---|---|---|---|---|---|---|---|---|
| 2013 | 105 | 71 | 42 | 116 | 58 | 95 | 106 | 69 | 117 | 119 | 160 | 274 |
| 2014 | 206 | 139 | 97 | 139 | 171 | 180 | 250 | 266 | 150 | 195 | 134 | 200 |
| 2015 | 219 | 174 | 217 | 295 | 255 | 353 | 192 | 255 | 219 | 237 | 269 | 340 |
| 2016 | 250 | 247 | 186 | 221 | 226 | 165 | 192 | 161 | 238 | 217 | 230 | 141 |
| 2017 | 220 | 224 | 217 | 191 | 263 | 217 | 182 | 250 | 238 | 168 | 268 | 291 |
| 2018 | 262 | 182 | 250 | 294 | 211 | 272 | 297 | 228 | 356 | 272 | 278 | 255 |
| 2019 | 232 | 246 | 205 | 181 | 197 | 219 | 209 | 218 | 240 | 211 | 230 | 219 |
| 2020 | 193 | 304 | 282 | 379 | 166 | 180 | 205 | 206 | 275 | 318 | 227 | 337 |
| 2021 | 378 | 330 | 224 | 247 | 390 | 417 | 336 | 399 | 319 | 293 | 420 | 476 |
| 2022 | 348 | 345 | 402 | 315 | 295 | 217 | 223 | 204 | 239 | 210 | 226 | 218 |
| 2023 | 197 | 288 | 297 | 343 | 340 | 310 | 287 | 244 | 339 | 300 | 306 | 369 |
| 2024 | 414 | |||||||||||
| - = No Data Reported; -- = Not Applicable; NA = Not Available; W = Withheld to avoid disclosure of individual company data. |
| Release Date: 3/29/2024 |
| Next Release Date: 4/30/2024 |