|
Download Data (XLS File) |
|
||||||||
|
||||||||
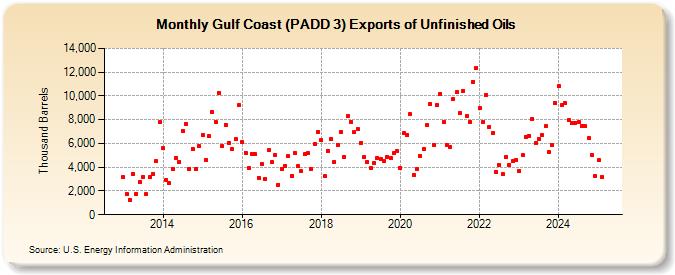
| Gulf Coast (PADD 3) Exports of Unfinished Oils (Thousand Barrels) | ||||||||
| Year | Jan | Feb | Mar | Apr | May | Jun | Jul | Aug | Sep | Oct | Nov | Dec |
|---|---|---|---|---|---|---|---|---|---|---|---|---|
| 1991 | 0 | 0 | 0 | 0 | 0 | 0 | 0 | 0 | 0 | 0 | 0 | 0 |
| 1992 | 0 | 0 | 0 | 0 | 0 | 0 | 0 | 0 | 0 | 0 | 0 | 0 |
| 2013 | 3,146 | 1,728 | 1,265 | 3,444 | 1,764 | 2,767 | 3,164 | 1,717 | 3,152 | 3,441 | 4,483 | 7,789 |
| 2014 | 5,579 | 2,920 | 2,635 | 3,877 | 4,809 | 4,479 | 7,073 | 7,672 | 3,885 | 5,570 | 3,844 | 5,773 |
| 2015 | 6,668 | 4,646 | 6,618 | 8,649 | 7,810 | 10,246 | 5,798 | 7,572 | 6,065 | 5,503 | 6,334 | 9,213 |
| 2016 | 6,128 | 5,217 | 3,926 | 5,149 | 5,074 | 3,124 | 4,276 | 3,044 | 5,418 | 4,398 | 5,056 | 2,526 |
| 2017 | 3,873 | 4,120 | 4,904 | 3,294 | 5,235 | 4,060 | 3,647 | 5,073 | 5,155 | 3,864 | 5,912 | 7,000 |
| 2018 | 6,249 | 3,246 | 5,392 | 6,367 | 4,443 | 5,903 | 6,993 | 4,880 | 8,282 | 7,811 | 6,934 | 7,215 |
| 2019 | 6,039 | 4,844 | 4,438 | 3,918 | 4,362 | 4,775 | 4,693 | 4,497 | 4,900 | 4,743 | 5,154 | 5,370 |
| 2020 | 3,935 | 6,844 | 6,733 | 8,451 | 3,361 | 3,880 | 4,938 | 5,544 | 7,537 | 9,328 | 5,849 | 9,199 |
| 2021 | 10,200 | 7,811 | 5,853 | 5,731 | 9,760 | 10,295 | 8,548 | 10,416 | 8,314 | 7,788 | 11,208 | 12,357 |
| 2022 | 8,960 | 7,821 | 10,078 | 7,409 | 6,875 | 3,609 | 4,185 | 3,420 | 4,890 | 4,208 | 4,482 | 4,604 |
| 2023 | 3,647 | 5,610 | 6,829 | 6,900 | 7,773 | 6,372 | 6,007 | 5,713 | 7,454 | 5,674 | 5,880 | 9,063 |
| 2024 | 10,793 | |||||||||||
| - = No Data Reported; -- = Not Applicable; NA = Not Available; W = Withheld to avoid disclosure of individual company data. |
| Release Date: 3/29/2024 |
| Next Release Date: 4/30/2024 |