|
Download Data (XLS File) |
|
||||||||
|
||||||||
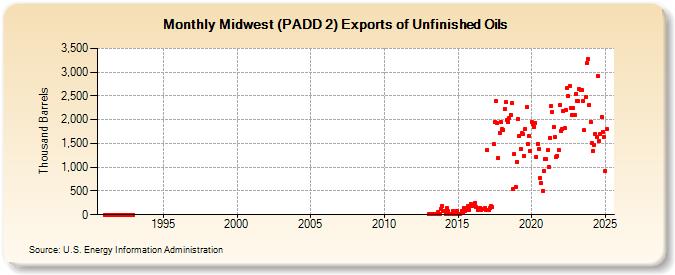
| Midwest (PADD 2) Exports of Unfinished Oils (Thousand Barrels) | ||||||||
| Year | Jan | Feb | Mar | Apr | May | Jun | Jul | Aug | Sep | Oct | Nov | Dec |
|---|---|---|---|---|---|---|---|---|---|---|---|---|
| 1991 | 0 | 0 | 0 | 0 | 0 | 0 | 0 | 0 | 0 | 0 | 0 | 0 |
| 1992 | 0 | 0 | 0 | 0 | 0 | 0 | 0 | 0 | 0 | 0 | 0 | 0 |
| 2013 | 13 | 10 | 13 | 12 | 6 | 10 | 7 | 21 | 61 | 21 | 126 | 190 |
| 2014 | 77 | 74 | 13 | 138 | 69 | 16 | 16 | 15 | 71 | 15 | 16 | 87 |
| 2015 | 13 | 14 | 16 | 68 | 47 | 140 | 69 | 89 | 176 | 108 | 185 | 223 |
| 2016 | 181 | 180 | 256 | 158 | 109 | 102 | 148 | 100 | 114 | 123 | 147 | 108 |
| 2017 | 1,370 | 97 | 144 | 182 | 162 | 1,479 | 1,946 | 2,400 | 1,924 | 1,191 | 1,725 | 1,955 |
| 2018 | 1,802 | 1,783 | 2,226 | 2,366 | 2,001 | 1,951 | 2,039 | 2,104 | 2,349 | 535 | 1,280 | 585 |
| 2019 | 1,118 | 2,009 | 1,659 | 1,385 | 1,719 | 1,700 | 1,245 | 1,805 | 2,270 | 1,495 | 1,666 | 1,348 |
| 2020 | 1,953 | 1,902 | 1,852 | 1,929 | 1,216 | 1,495 | 1,379 | 774 | 662 | 509 | 915 | 1,180 |
| 2021 | 1,164 | 1,354 | 1,000 | 1,624 | 2,283 | 2,171 | 1,846 | 1,632 | 1,212 | 1,245 | 1,364 | 2,306 |
| 2022 | 1,768 | 1,794 | 2,174 | 1,822 | 2,214 | 2,667 | 2,488 | 2,707 | 2,248 | 2,106 | 2,238 | 2,101 |
| 2023 | 2,429 | 2,398 | 2,309 | 2,539 | 2,626 | 2,616 | 2,395 | 1,777 | 2,477 | 3,187 | 3,275 | 2,312 |
| 2024 | 1,948 | 1,511 | 1,343 | 1,459 | ||||||||
| - = No Data Reported; -- = Not Applicable; NA = Not Available; W = Withheld to avoid disclosure of individual company data. |
| Release Date: 6/28/2024 |
| Next Release Date: 7/31/2024 |