|
Download Data (XLS File) |
|
||||||||
|
||||||||
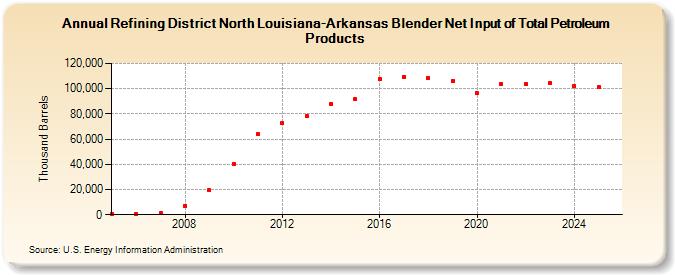
| Refining District North Louisiana-Arkansas Blender Net Input of Total Petroleum Products (Thousand Barrels) | ||||||||
| Decade | Year-0 | Year-1 | Year-2 | Year-3 | Year-4 | Year-5 | Year-6 | Year-7 | Year-8 | Year-9 |
|---|---|---|---|---|---|---|---|---|---|---|
| 2000's | 456 | 453 | 1,097 | 7,240 | 19,356 | |||||
| 2010's | 40,600 | 63,897 | 72,715 | 78,061 | 87,959 | 91,639 | 107,769 | 109,594 | 108,455 | 106,441 |
| 2020's | 96,556 | 103,734 | 103,892 | 104,607 |
| - = No Data Reported; -- = Not Applicable; NA = Not Available; W = Withheld to avoid disclosure of individual company data. |
| Release Date: 4/30/2024 |
| Next Release Date: 8/30/2024 |