|
Download Data (XLS File) |
|
||||||||
|
||||||||
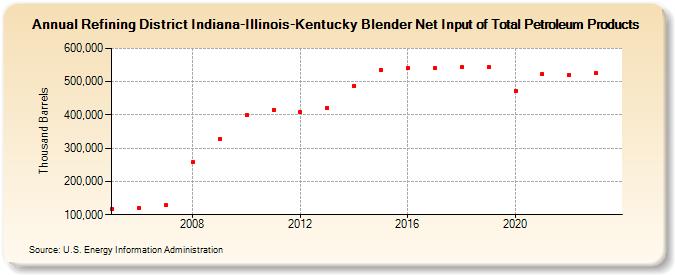
| Refining District Indiana-Illinois-Kentucky Blender Net Input of Total Petroleum Products (Thousand Barrels) | ||||||||
| Decade | Year-0 | Year-1 | Year-2 | Year-3 | Year-4 | Year-5 | Year-6 | Year-7 | Year-8 | Year-9 |
|---|---|---|---|---|---|---|---|---|---|---|
| 2000's | 117,409 | 120,289 | 128,335 | 257,472 | 328,854 | |||||
| 2010's | 399,533 | 415,863 | 408,809 | 421,090 | 487,765 | 534,964 | 540,005 | 540,990 | 544,009 | 542,611 |
| 2020's | 472,368 | 523,463 | 520,837 | 526,129 |
| - = No Data Reported; -- = Not Applicable; NA = Not Available; W = Withheld to avoid disclosure of individual company data. |
| Release Date: 3/29/2024 |
| Next Release Date: 8/30/2024 |