|
Download Data (XLS File) |
|
||||||||
|
||||||||
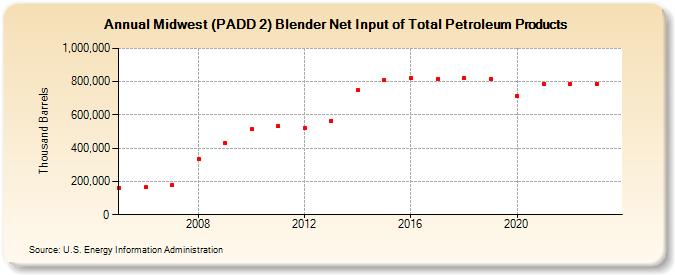
| Midwest (PADD 2) Blender Net Input of Total Petroleum Products (Thousand Barrels) | ||||||||
| Decade | Year-0 | Year-1 | Year-2 | Year-3 | Year-4 | Year-5 | Year-6 | Year-7 | Year-8 | Year-9 |
|---|---|---|---|---|---|---|---|---|---|---|
| 2000's | 161,482 | 164,400 | 180,082 | 336,034 | 428,988 | |||||
| 2010's | 512,953 | 532,539 | 524,067 | 566,202 | 749,082 | 810,142 | 822,423 | 817,314 | 821,285 | 816,300 |
| 2020's | 711,665 | 788,117 | 787,052 | 787,662 |
| - = No Data Reported; -- = Not Applicable; NA = Not Available; W = Withheld to avoid disclosure of individual company data. |
| Release Date: 3/29/2024 |
| Next Release Date: 8/30/2024 |
Referring Pages: