|
Download Data (XLS File) |
|
||||||||
|
||||||||
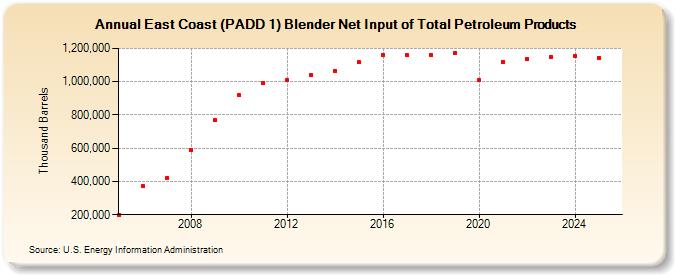
| East Coast (PADD 1) Blender Net Input of Total Petroleum Products (Thousand Barrels) | ||||||||
| Decade | Year-0 | Year-1 | Year-2 | Year-3 | Year-4 | Year-5 | Year-6 | Year-7 | Year-8 | Year-9 |
|---|---|---|---|---|---|---|---|---|---|---|
| 2000's | 200,458 | 372,388 | 421,480 | 588,546 | 768,383 | |||||
| 2010's | 918,190 | 993,031 | 1,010,148 | 1,039,162 | 1,066,199 | 1,115,235 | 1,161,800 | 1,157,501 | 1,159,277 | 1,175,028 |
| 2020's | 1,010,278 | 1,120,540 | 1,136,873 | 1,147,945 |
| - = No Data Reported; -- = Not Applicable; NA = Not Available; W = Withheld to avoid disclosure of individual company data. |
| Release Date: 3/29/2024 |
| Next Release Date: 8/30/2024 |
Referring Pages: