|
Download Data (XLS File) |
|
||||||||
|
||||||||
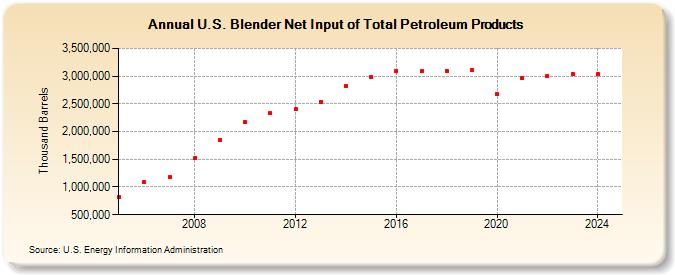
| U.S. Blender Net Input of Total Petroleum Products (Thousand Barrels) | ||||||||
| Decade | Year-0 | Year-1 | Year-2 | Year-3 | Year-4 | Year-5 | Year-6 | Year-7 | Year-8 | Year-9 |
|---|---|---|---|---|---|---|---|---|---|---|
| 2000's | 810,545 | 1,087,413 | 1,184,435 | 1,522,193 | 1,850,204 | |||||
| 2010's | 2,166,784 | 2,331,109 | 2,399,318 | 2,539,812 | 2,824,480 | 2,989,233 | 3,094,634 | 3,086,229 | 3,097,718 | 3,109,028 |
| 2020's | 2,681,177 | 2,964,286 | 2,997,341 | 3,027,649 |
| - = No Data Reported; -- = Not Applicable; NA = Not Available; W = Withheld to avoid disclosure of individual company data. |
| Release Date: 3/29/2024 |
| Next Release Date: 8/30/2024 |
Referring Pages: