|
Download Data (XLS File) |
|
||||||||
|
||||||||
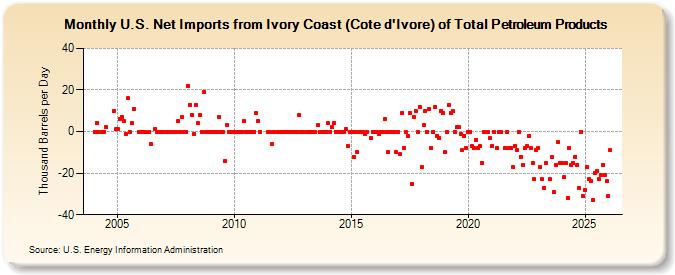
| U.S. Net Imports from Ivory Coast (Cote d'Ivore) of Total Petroleum Products (Thousand Barrels per Day) | ||||||||
| Year | Jan | Feb | Mar | Apr | May | Jun | Jul | Aug | Sep | Oct | Nov | Dec |
|---|---|---|---|---|---|---|---|---|---|---|---|---|
| 2004 | 0 | 4 | 0 | 0 | 0 | 2 | 10 | 1 | ||||
| 2005 | 1 | 6 | 7 | 5 | -1 | 16 | 0 | 4 | 11 | 0 | ||
| 2006 | 0 | 0 | 0 | 0 | -6 | 1 | 0 | 0 | 0 | 0 | ||
| 2007 | 0 | 0 | 0 | 0 | 0 | 5 | 0 | 7 | 0 | 0 | ||
| 2008 | 22 | 13 | 8 | -1 | 13 | 4 | 8 | 0 | 19 | 0 | 0 | 0 |
| 2009 | 0 | 0 | 0 | 0 | 7 | 0 | 0 | -14 | 3 | 0 | 0 | 0 |
| 2010 | 0 | 0 | 0 | 0 | 0 | 5 | 0 | 0 | 0 | 0 | 0 | 9 |
| 2011 | 5 | 0 | 0 | 0 | -6 | 0 | 0 | 0 | ||||
| 2012 | 0 | 0 | 0 | 0 | 0 | 0 | 0 | 0 | 0 | 8 | 0 | 0 |
| 2013 | 0 | 0 | 0 | 0 | 0 | 3 | 0 | 0 | 0 | 0 | ||
| 2014 | 4 | 0 | 2 | 4 | 0 | 0 | 0 | 0 | 0 | 1 | -7 | 0 |
| 2015 | 0 | -12 | 0 | -10 | 0 | 0 | 0 | -1 | 0 | -3 | 0 | |
| 2016 | 0 | 0 | -1 | 0 | 0 | 6 | 0 | -10 | 0 | 0 | 0 | -10 |
| 2017 | 0 | -11 | 9 | -8 | 0 | -2 | 9 | -25 | 7 | 10 | 0 | 12 |
| 2018 | -17 | 3 | 10 | 0 | 11 | -8 | 0 | 12 | -2 | -3 | 10 | 9 |
| 2019 | -10 | 0 | 13 | 9 | 10 | 0 | 2 | 2 | -1 | -9 | -2 | -8 |
| 2020 | 0 | 0 | -7 | -8 | -4 | -8 | -7 | -15 | 0 | 0 | -3 | |
| 2021 | -7 | 0 | -8 | 0 | 0 | -8 | 0 | -8 | -8 | -17 | ||
| 2022 | -7 | -9 | 0 | -12 | -16 | -8 | -7 | -2 | -8 | -15 | -23 | -9 |
| 2023 | -8 | -17 | -29 | -27 | -15 | -27 | -12 | -29 | -16 | -5 | -15 | |
| 2024 | -15 | -22 | -15 | -32 | ||||||||
| - = No Data Reported; -- = Not Applicable; NA = Not Available; W = Withheld to avoid disclosure of individual company data. |
| Release Date: 6/28/2024 |
| Next Release Date: 7/31/2024 |