|
Download Data (XLS File) |
|
||||||||
|
||||||||
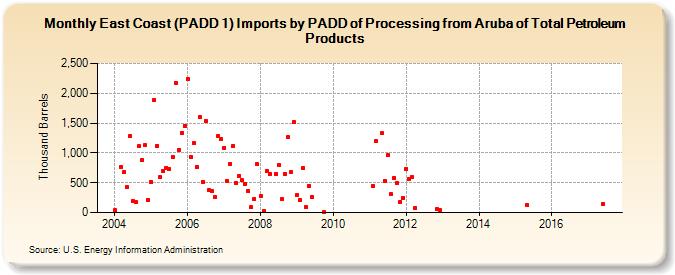
| East Coast (PADD 1) Imports by PADD of Processing from Aruba of Total Petroleum Products (Thousand Barrels) | ||||||||
| Year | Jan | Feb | Mar | Apr | May | Jun | Jul | Aug | Sep | Oct | Nov | Dec |
|---|---|---|---|---|---|---|---|---|---|---|---|---|
| 2004 | 35 | 766 | 672 | 421 | 1,286 | 188 | 175 | 1,115 | 880 | 1,128 | 216 | |
| 2005 | 516 | 1,892 | 1,122 | 591 | 694 | 752 | 734 | 932 | 2,173 | 1,055 | 1,338 | 1,459 |
| 2006 | 2,245 | 933 | 1,163 | 761 | 1,596 | 516 | 1,537 | 378 | 357 | 260 | 1,284 | 1,231 |
| 2007 | 1,088 | 529 | 817 | 1,115 | 493 | 619 | 538 | 485 | 361 | 87 | 230 | 813 |
| 2008 | 276 | 22 | 693 | 650 | 651 | 792 | 225 | 652 | 1,260 | 672 | 1,515 | |
| 2009 | 288 | 203 | 750 | 91 | 451 | 257 | 3 | |||||
| 2011 | 444 | 1,194 | 1,327 | 533 | 963 | 304 | 586 | 499 | 181 | 247 | ||
| 2012 | 737 | 571 | 600 | 82 | 57 | 35 | ||||||
| 2015 | 123 | |||||||||||
| 2017 | 151 | |||||||||||
| - = No Data Reported; -- = Not Applicable; NA = Not Available; W = Withheld to avoid disclosure of individual company data. |
| Release Date: 8/30/2024 |
| Next Release Date: 9/30/2024 |