|
Download Data (XLS File) |
|
||||||||
|
||||||||
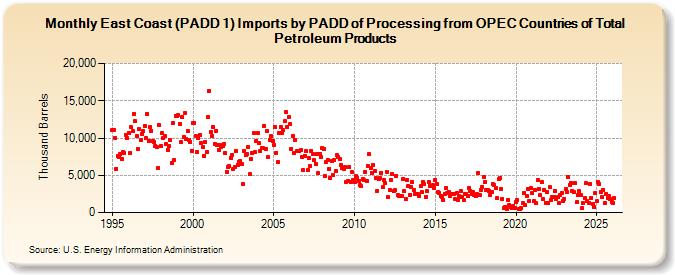
| East Coast (PADD 1) Imports by PADD of Processing from OPEC Countries of Total Petroleum Products (Thousand Barrels) | ||||||||
| Year | Jan | Feb | Mar | Apr | May | Jun | Jul | Aug | Sep | Oct | Nov | Dec |
|---|---|---|---|---|---|---|---|---|---|---|---|---|
| 1995 | 11,085 | 11,140 | 10,036 | 5,894 | 7,637 | 7,410 | 7,819 | 7,212 | 8,067 | 7,997 | 10,466 | 10,018 |
| 1996 | 10,651 | 8,002 | 11,442 | 10,997 | 13,285 | 12,239 | 10,255 | 8,508 | 11,163 | 9,730 | 10,605 | 10,883 |
| 1997 | 11,659 | 9,976 | 13,286 | 9,596 | 11,501 | 11,007 | 9,618 | 9,471 | 8,987 | 8,820 | 6,035 | 11,695 |
| 1998 | 8,873 | 10,650 | 10,021 | 10,225 | 9,175 | 8,403 | 8,939 | 9,721 | 6,707 | 12,041 | 7,026 | 12,982 |
| 1999 | 12,932 | 13,112 | 11,927 | 9,429 | 12,793 | 10,138 | 13,372 | 9,844 | 10,973 | 9,752 | 9,489 | 8,323 |
| 2000 | 11,967 | 11,998 | 10,302 | 8,108 | 10,051 | 10,396 | 9,281 | 8,786 | 7,638 | 9,495 | 8,074 | 12,847 |
| 2001 | 16,362 | 10,820 | 10,242 | 11,461 | 9,211 | 10,972 | 9,100 | 8,333 | 9,072 | 8,821 | 8,944 | 9,162 |
| 2002 | 7,988 | 5,489 | 6,143 | 6,186 | 7,379 | 7,725 | 5,894 | 6,168 | 8,287 | 6,419 | 6,850 | 6,928 |
| 2003 | 6,511 | 3,780 | 8,277 | 7,675 | 7,811 | 8,842 | 5,157 | 7,204 | 7,973 | 10,615 | 8,117 | 9,650 |
| 2004 | 10,651 | 9,266 | 8,275 | 8,633 | 8,669 | 11,632 | 8,483 | 10,882 | 7,395 | 9,766 | 10,265 | 9,549 |
| 2005 | 9,100 | 11,529 | 8,047 | 6,750 | 10,637 | 11,437 | 10,731 | 11,050 | 12,236 | 13,511 | 11,529 | 12,812 |
| 2006 | 11,862 | 8,564 | 10,299 | 7,935 | 9,723 | 8,225 | 8,236 | 8,226 | 8,399 | 7,513 | 5,671 | 7,622 |
| 2007 | 8,258 | 5,675 | 7,333 | 6,263 | 8,286 | 7,815 | 6,986 | 6,563 | 7,917 | 5,251 | 7,894 | 7,447 |
| 2008 | 8,685 | 8,593 | 4,877 | 6,756 | 7,051 | 5,889 | 4,652 | 6,946 | 5,031 | 7,089 | 5,621 | 7,664 |
| 2009 | 7,434 | 7,141 | 6,398 | 5,944 | 5,885 | 6,049 | 4,138 | 4,199 | 6,100 | 4,036 | 5,432 | 4,429 |
| 2010 | 4,146 | 4,888 | 4,651 | 4,167 | 3,721 | 3,513 | 4,470 | 4,419 | 5,497 | 4,234 | 6,301 | 7,800 |
| 2011 | 6,039 | 5,361 | 6,391 | 5,535 | 4,605 | 2,902 | 4,451 | 4,670 | 5,331 | 3,376 | 4,391 | 3,926 |
| 2012 | 5,486 | 2,060 | 3,064 | 4,414 | 5,154 | 2,834 | 2,980 | 4,946 | 2,406 | 2,211 | 2,237 | 2,277 |
| 2013 | 4,565 | 2,850 | 1,875 | 4,396 | 3,539 | 2,393 | 3,397 | 4,160 | 2,974 | 2,529 | 2,448 | 2,444 |
| 2014 | 2,281 | 3,522 | 2,748 | 4,130 | 3,837 | 2,153 | 2,833 | 4,110 | 3,605 | 3,531 | 3,635 | 3,313 |
| 2015 | 4,395 | 3,889 | 2,704 | 2,654 | 2,247 | 2,113 | 1,680 | 2,518 | 3,264 | 2,558 | 2,732 | 2,251 |
| 2016 | 2,528 | 2,534 | 2,557 | 1,784 | 2,572 | 1,743 | 2,158 | 2,946 | 2,148 | 1,620 | 2,500 | 2,439 |
| 2017 | 2,231 | 3,333 | 2,921 | 2,530 | 2,708 | 2,310 | 2,210 | 2,482 | 5,338 | 2,394 | 3,027 | 3,475 |
| 2018 | 4,836 | 4,037 | 2,977 | 3,040 | 2,869 | 2,389 | 2,722 | 3,862 | 3,696 | 3,307 | 1,895 | 4,500 |
| 2019 | 4,653 | 3,197 | 1,831 | 554 | 751 | 505 | 1,717 | 985 | 697 | 571 | 888 | 669 |
| 2020 | 1,430 | 1,620 | 528 | 444 | 566 | 1,278 | 2,621 | 980 | 2,226 | 3,127 | 1,584 | 3,273 |
| 2021 | 2,582 | 1,489 | 3,060 | 1,292 | 4,401 | 3,223 | 2,323 | 4,040 | 1,808 | 3,032 | 1,334 | 2,730 |
| 2022 | 1,266 | 3,365 | 1,675 | 2,073 | 2,136 | 2,884 | 1,759 | 2,059 | 1,235 | 2,364 | 2,647 | 1,617 |
| 2023 | 1,852 | 3,204 | 2,709 | 4,812 | 3,764 | 3,946 | 2,952 | 2,739 | 3,987 | 1,355 | 2,302 | 2,840 |
| 2024 | 2,382 | 571 | 1,226 | 1,904 | 3,918 | 1,022 | ||||||
| - = No Data Reported; -- = Not Applicable; NA = Not Available; W = Withheld to avoid disclosure of individual company data. |
| Release Date: 8/30/2024 |
| Next Release Date: 9/30/2024 |