|
Download Data (XLS File) |
|
||||||||
|
||||||||
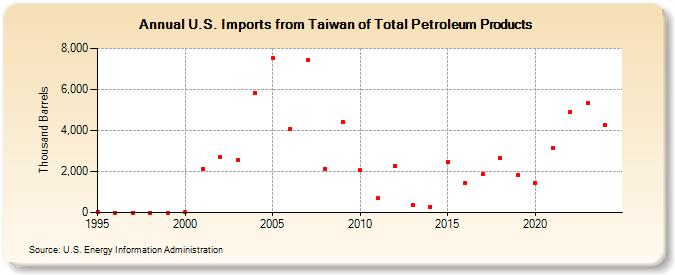
| U.S. Imports from Taiwan of Total Petroleum Products (Thousand Barrels) | ||||||||
| Decade | Year-0 | Year-1 | Year-2 | Year-3 | Year-4 | Year-5 | Year-6 | Year-7 | Year-8 | Year-9 |
|---|---|---|---|---|---|---|---|---|---|---|
| 1990's | 27 | 0 | 0 | 0 | 0 | |||||
| 2000's | 26 | 2,137 | 2,695 | 2,545 | 5,822 | 7,534 | 4,075 | 7,420 | 2,125 | 4,403 |
| 2010's | 2,073 | 695 | 2,274 | 363 | 284 | 2,453 | 1,429 | 1,870 | 2,660 | 1,838 |
| 2020's | 1,458 | 3,134 | 4,915 | 5,317 |
| - = No Data Reported; -- = Not Applicable; NA = Not Available; W = Withheld to avoid disclosure of individual company data. |
| Release Date: 3/29/2024 |
| Next Release Date: 8/30/2024 |
Referring Pages: