|
Download Data (XLS File) |
|
||||||||
|
||||||||
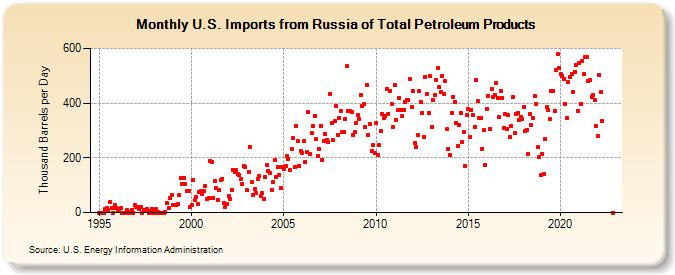
| U.S. Imports from Russia of Total Petroleum Products (Thousand Barrels per Day) | ||||||||
| Year | Jan | Feb | Mar | Apr | May | Jun | Jul | Aug | Sep | Oct | Nov | Dec |
|---|---|---|---|---|---|---|---|---|---|---|---|---|
| 1995 | 0 | 0 | 0 | 0 | 12 | 15 | 8 | 37 | 18 | 0 | 28 | 15 |
| 1996 | 11 | 14 | 18 | 0 | 0 | 0 | 9 | 0 | 2 | 10 | 0 | 26 |
| 1997 | 21 | 19 | 13 | 20 | 0 | 8 | 9 | 13 | 0 | 7 | 14 | 0 |
| 1998 | 0 | 12 | 3 | 0 | 0 | 0 | 0 | 1 | 34 | 15 | 54 | 63 |
| 1999 | 28 | 28 | 26 | 32 | 65 | 127 | 106 | 125 | 103 | 79 | 79 | 19 |
| 2000 | 29 | 120 | 46 | 57 | 31 | 75 | 78 | 67 | 80 | 97 | 50 | 55 |
| 2001 | 190 | 183 | 53 | 115 | 88 | 47 | 81 | 118 | 124 | 34 | 22 | 30 |
| 2002 | 61 | 51 | 83 | 156 | 150 | 154 | 141 | 136 | 122 | 105 | 170 | 168 |
| 2003 | 82 | 149 | 241 | 113 | 66 | 86 | 72 | 123 | 132 | 59 | 71 | 51 |
| 2004 | 129 | 174 | 153 | 144 | 84 | 111 | 191 | 130 | 167 | 139 | 89 | 168 |
| 2005 | 161 | 170 | 206 | 196 | 156 | 233 | 273 | 165 | 316 | 260 | 170 | 225 |
| 2006 | 219 | 262 | 186 | 220 | 366 | 215 | 291 | 318 | 353 | 268 | 208 | 231 |
| 2007 | 317 | 192 | 262 | 287 | 266 | 257 | 435 | 326 | 265 | 334 | 389 | 285 |
| 2008 | 346 | 371 | 294 | 296 | 341 | 535 | 370 | 370 | 368 | 283 | 293 | 328 |
| 2009 | 358 | 343 | 431 | 389 | 397 | 313 | 465 | 284 | 323 | 226 | 246 | 217 |
| 2010 | 326 | 210 | 246 | 299 | 361 | 344 | 352 | 453 | 362 | 445 | 397 | 313 |
| 2011 | 466 | 340 | 376 | 417 | 375 | 354 | 376 | 405 | 412 | 410 | 489 | 387 |
| 2012 | 446 | 256 | 238 | 282 | 444 | 403 | 365 | 277 | 497 | 433 | 365 | 499 |
| 2013 | 311 | 410 | 429 | 486 | 530 | 458 | 440 | 500 | 434 | 480 | 304 | 234 |
| 2014 | 212 | 365 | 424 | 405 | 328 | 243 | 320 | 363 | 258 | 293 | 170 | 355 |
| 2015 | 378 | 275 | 376 | 358 | 314 | 484 | 406 | 344 | 345 | 234 | 300 | 172 |
| 2016 | 379 | 427 | 307 | 451 | 423 | 428 | 475 | 420 | 348 | 445 | 419 | 310 |
| 2017 | 361 | 306 | 356 | 277 | 316 | 424 | 291 | 359 | 364 | 337 | 351 | 341 |
| 2018 | 386 | 297 | 300 | 214 | 361 | 320 | 347 | 425 | 396 | 238 | 204 | 137 |
| 2019 | 215 | 140 | 269 | 384 | 374 | 341 | 443 | 445 | 373 | 520 | 578 | 527 |
| 2020 | 506 | 500 | 488 | 395 | 346 | 476 | 497 | 505 | 441 | 515 | 539 | 370 |
| 2021 | 547 | 398 | 553 | 506 | 567 | 568 | 479 | 484 | 424 | 429 | 413 | 315 |
| 2022 | 278 | 503 | 439 | 336 | 0 | |||||||
| - = No Data Reported; -- = Not Applicable; NA = Not Available; W = Withheld to avoid disclosure of individual company data. |
| Release Date: 6/28/2024 |
| Next Release Date: 7/31/2024 |
Referring Pages: