|
Download Data (XLS File) |
|
||||||||
|
||||||||
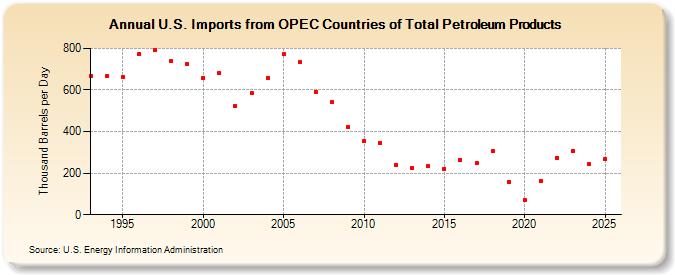
| U.S. Imports from OPEC Countries of Total Petroleum Products (Thousand Barrels per Day) | ||||||||
| Decade | Year-0 | Year-1 | Year-2 | Year-3 | Year-4 | Year-5 | Year-6 | Year-7 | Year-8 | Year-9 |
|---|---|---|---|---|---|---|---|---|---|---|
| 1990's | 667 | 667 | 661 | 773 | 793 | 737 | 725 | |||
| 2000's | 659 | 680 | 522 | 584 | 659 | 771 | 733 | 592 | 540 | 421 |
| 2010's | 354 | 347 | 240 | 227 | 232 | 221 | 265 | 249 | 305 | 158 |
| 2020's | 71 | 161 | 275 | 306 |
| - = No Data Reported; -- = Not Applicable; NA = Not Available; W = Withheld to avoid disclosure of individual company data. |
| Release Date: 3/29/2024 |
| Next Release Date: 8/30/2024 |
Referring Pages: