|
Download Data (XLS File) |
|
||||||||
|
||||||||
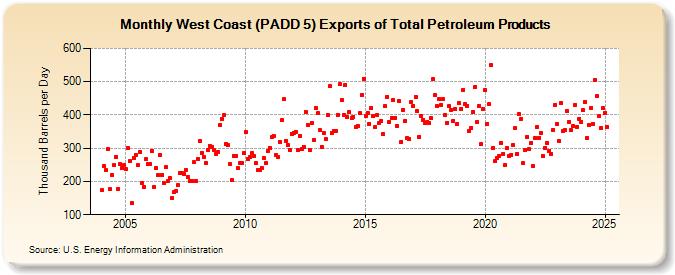
| West Coast (PADD 5) Exports of Total Petroleum Products (Thousand Barrels per Day) | ||||||||
| Year | Jan | Feb | Mar | Apr | May | Jun | Jul | Aug | Sep | Oct | Nov | Dec |
|---|---|---|---|---|---|---|---|---|---|---|---|---|
| 2004 | 173 | 245 | 234 | 297 | 176 | 219 | 248 | 275 | 178 | 252 | 240 | 248 |
| 2005 | 236 | 301 | 261 | 135 | 270 | 279 | 248 | 289 | 196 | 184 | 266 | 251 |
| 2006 | 252 | 293 | 184 | 241 | 219 | 280 | 220 | 195 | 242 | 200 | 210 | 151 |
| 2007 | 168 | 171 | 189 | 226 | 224 | 223 | 234 | 214 | 202 | 201 | 257 | 201 |
| 2008 | 268 | 323 | 286 | 275 | 256 | 295 | 308 | 305 | 295 | 283 | 289 | 370 |
| 2009 | 388 | 399 | 313 | 309 | 251 | 204 | 278 | 276 | 239 | 255 | 256 | 285 |
| 2010 | 349 | 267 | 274 | 285 | 278 | 256 | 234 | 235 | 241 | 271 | 255 | 291 |
| 2011 | 301 | 333 | 338 | 279 | 274 | 319 | 384 | 447 | 322 | 310 | 295 | 344 |
| 2012 | 347 | 350 | 294 | 338 | 297 | 305 | 410 | 370 | 296 | 376 | 326 | 420 |
| 2013 | 405 | 355 | 305 | 346 | 328 | 400 | 486 | 345 | 353 | 353 | 400 | 492 |
| 2014 | 445 | 400 | 491 | 394 | 409 | 392 | 395 | 364 | 368 | 405 | 460 | 509 |
| 2015 | 398 | 407 | 373 | 422 | 397 | 364 | 401 | 376 | 383 | 342 | 426 | 455 |
| 2016 | 380 | 392 | 445 | 392 | 367 | 441 | 320 | 415 | 383 | 331 | 328 | 440 |
| 2017 | 428 | 455 | 411 | 335 | 398 | 385 | 376 | 380 | 375 | 390 | 507 | 459 |
| 2018 | 426 | 448 | 430 | 447 | 400 | 377 | 426 | 415 | 383 | 418 | 374 | 435 |
| 2019 | 419 | 476 | 432 | 428 | 351 | 362 | 409 | 485 | 379 | 427 | 312 | 419 |
| 2020 | 476 | 373 | 432 | 549 | 302 | 261 | 270 | 276 | 316 | 284 | 248 | 300 |
| 2021 | 277 | 281 | 310 | 362 | 284 | 402 | 389 | 254 | 296 | 334 | 297 | 315 |
| 2022 | 245 | 332 | 365 | 332 | 347 | 277 | 302 | 316 | 292 | 284 | 355 | 431 |
| 2023 | 389 | 314 | 409 | 402 | 324 | 414 | 380 | 362 | 349 | 436 | 365 | 395 |
| 2024 | 380 | |||||||||||
| - = No Data Reported; -- = Not Applicable; NA = Not Available; W = Withheld to avoid disclosure of individual company data. |
| Release Date: 3/29/2024 |
| Next Release Date: 4/30/2024 |