|
Download Data (XLS File) |
|
||||||||
|
||||||||
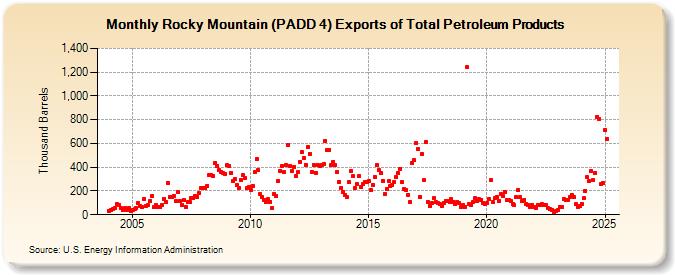
| Rocky Mountain (PADD 4) Exports of Total Petroleum Products (Thousand Barrels) | ||||||||
| Year | Jan | Feb | Mar | Apr | May | Jun | Jul | Aug | Sep | Oct | Nov | Dec |
|---|---|---|---|---|---|---|---|---|---|---|---|---|
| 2004 | 34 | 39 | 44 | 54 | 87 | 82 | 55 | 37 | 53 | 40 | 55 | 33 |
| 2005 | 42 | 44 | 56 | 97 | 77 | 63 | 135 | 77 | 78 | 117 | 159 | 62 |
| 2006 | 79 | 64 | 62 | 83 | 136 | 106 | 267 | 153 | 153 | 158 | 115 | 192 |
| 2007 | 117 | 82 | 124 | 69 | 109 | 110 | 138 | 139 | 155 | 150 | 183 | 224 |
| 2008 | 228 | 226 | 245 | 332 | 332 | 329 | 436 | 411 | 375 | 360 | 347 | 344 |
| 2009 | 416 | 412 | 355 | 281 | 298 | 247 | 228 | 294 | 332 | 313 | 221 | 232 |
| 2010 | 212 | 243 | 358 | 468 | 376 | 173 | 150 | 125 | 108 | 129 | 110 | 55 |
| 2011 | 174 | 157 | 282 | 372 | 412 | 360 | 420 | 584 | 414 | 368 | 404 | 324 |
| 2012 | 359 | 447 | 524 | 474 | 421 | 571 | 512 | 360 | 419 | 354 | 418 | 406 |
| 2013 | 421 | 426 | 619 | 543 | 547 | 415 | 446 | 417 | 358 | 278 | 229 | 195 |
| 2014 | 167 | 146 | 274 | 365 | 325 | 222 | 262 | 326 | 234 | 258 | 278 | 272 |
| 2015 | 282 | 205 | 253 | 321 | 416 | 373 | 350 | 286 | 175 | 220 | 283 | 238 |
| 2016 | 248 | 274 | 315 | 350 | 385 | 274 | 216 | 210 | 170 | 110 | 436 | 460 |
| 2017 | 604 | 555 | 153 | 515 | 290 | 615 | 108 | 75 | 96 | 137 | 105 | 97 |
| 2018 | 94 | 73 | 97 | 115 | 114 | 110 | 130 | 111 | 90 | 110 | 99 | 66 |
| 2019 | 83 | 69 | 1,243 | 86 | 85 | 106 | 138 | 118 | 129 | 127 | 102 | 89 |
| 2020 | 97 | 132 | 289 | 108 | 137 | 152 | 115 | 174 | 156 | 194 | 126 | 123 |
| 2021 | 117 | 89 | 80 | 146 | 208 | 149 | 115 | 128 | 92 | 78 | 65 | 82 |
| 2022 | 65 | 53 | 82 | 85 | 88 | 78 | 81 | 53 | 45 | 42 | 26 | 32 |
| 2023 | 42 | 67 | 62 | 72 | 121 | 123 | 146 | 169 | 153 | 87 | 69 | 73 |
| 2024 | 94 | |||||||||||
| - = No Data Reported; -- = Not Applicable; NA = Not Available; W = Withheld to avoid disclosure of individual company data. |
| Release Date: 3/29/2024 |
| Next Release Date: 4/30/2024 |