|
Download Data (XLS File) |
|
||||||||
|
||||||||
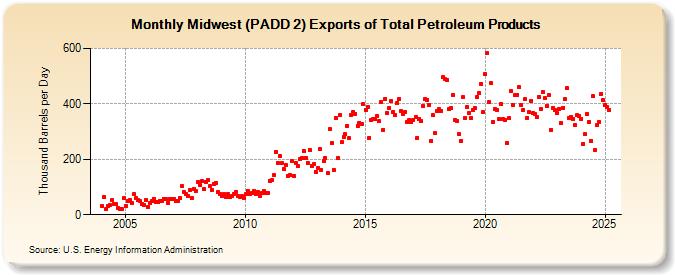
| Midwest (PADD 2) Exports of Total Petroleum Products (Thousand Barrels per Day) | ||||||||
| Year | Jan | Feb | Mar | Apr | May | Jun | Jul | Aug | Sep | Oct | Nov | Dec |
|---|---|---|---|---|---|---|---|---|---|---|---|---|
| 2004 | 32 | 63 | 19 | 32 | 34 | 53 | 40 | 39 | 26 | 22 | 20 | 61 |
| 2005 | 32 | 50 | 53 | 42 | 73 | 60 | 52 | 50 | 40 | 35 | 53 | 28 |
| 2006 | 42 | 49 | 58 | 45 | 45 | 51 | 51 | 58 | 55 | 44 | 57 | 56 |
| 2007 | 58 | 50 | 51 | 59 | 103 | 83 | 76 | 69 | 89 | 61 | 93 | 84 |
| 2008 | 118 | 108 | 120 | 91 | 119 | 124 | 102 | 90 | 112 | 116 | 82 | 76 |
| 2009 | 68 | 74 | 63 | 74 | 64 | 66 | 75 | 82 | 66 | 65 | 66 | 60 |
| 2010 | 74 | 87 | 76 | 77 | 85 | 73 | 82 | 69 | 78 | 85 | 78 | 77 |
| 2011 | 123 | 124 | 142 | 228 | 188 | 211 | 185 | 165 | 179 | 141 | 143 | 195 |
| 2012 | 141 | 188 | 175 | 200 | 204 | 230 | 205 | 188 | 234 | 177 | 182 | 155 |
| 2013 | 170 | 236 | 162 | 194 | 206 | 150 | 308 | 257 | 161 | 350 | 204 | 358 |
| 2014 | 261 | 280 | 290 | 320 | 276 | 361 | 371 | 365 | 321 | 332 | 329 | 399 |
| 2015 | 379 | 389 | 278 | 340 | 346 | 344 | 355 | 338 | 407 | 307 | 419 | 366 |
| 2016 | 386 | 410 | 372 | 359 | 404 | 419 | 374 | 362 | 370 | 336 | 342 | 333 |
| 2017 | 343 | 352 | 277 | 346 | 338 | 392 | 416 | 415 | 397 | 266 | 358 | 293 |
| 2018 | 373 | 380 | 373 | 496 | 489 | 486 | 381 | 385 | 432 | 340 | 338 | 290 |
| 2019 | 267 | 424 | 349 | 389 | 368 | 349 | 379 | 384 | 426 | 439 | 473 | 369 |
| 2020 | 506 | 582 | 405 | 474 | 335 | 382 | 376 | 346 | 399 | 345 | 341 | 259 |
| 2021 | 348 | 446 | 396 | 432 | 432 | 459 | 396 | 378 | 416 | 350 | 369 | 412 |
| 2022 | 367 | 363 | 352 | 426 | 382 | 442 | 421 | 393 | 431 | 306 | 385 | 377 |
| 2023 | 358 | 369 | 327 | 383 | 296 | 347 | 282 | 262 | 268 | 248 | 358 | 353 |
| 2024 | 346 | 256 | ||||||||||
| - = No Data Reported; -- = Not Applicable; NA = Not Available; W = Withheld to avoid disclosure of individual company data. |
| Release Date: 4/30/2024 |
| Next Release Date: 5/31/2024 |