|
Download Data (XLS File) |
|
||||||||
|
||||||||
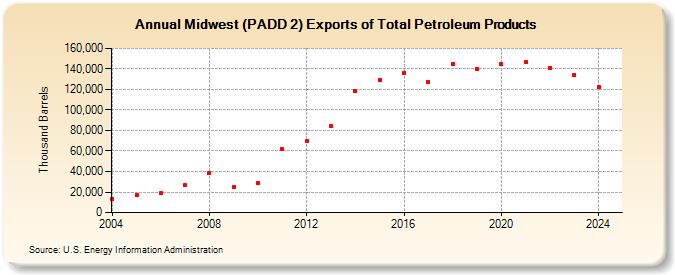
| Midwest (PADD 2) Exports of Total Petroleum Products (Thousand Barrels) | ||||||||
| Decade | Year-0 | Year-1 | Year-2 | Year-3 | Year-4 | Year-5 | Year-6 | Year-7 | Year-8 | Year-9 |
|---|---|---|---|---|---|---|---|---|---|---|
| 2000's | 13,396 | 17,263 | 18,593 | 26,673 | 38,419 | 24,996 | ||||
| 2010's | 28,584 | 61,636 | 69,404 | 83,994 | 118,856 | 129,601 | 136,171 | 127,436 | 144,813 | 140,191 |
| 2020's | 144,525 | 146,813 | 141,204 | 134,528 |
| - = No Data Reported; -- = Not Applicable; NA = Not Available; W = Withheld to avoid disclosure of individual company data. |
| Release Date: 8/30/2024 |
| Next Release Date: 8/29/2025 |