|
Download Data (XLS File) |
|
||||||||
|
||||||||
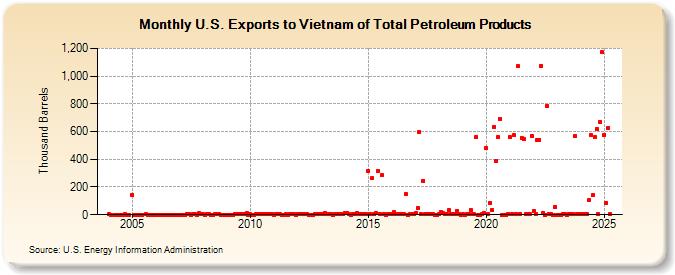
| U.S. Exports to Vietnam of Total Petroleum Products (Thousand Barrels) | ||||||||
| Year | Jan | Feb | Mar | Apr | May | Jun | Jul | Aug | Sep | Oct | Nov | Dec |
|---|---|---|---|---|---|---|---|---|---|---|---|---|
| 2004 | 3 | 0 | 0 | 0 | 0 | 0 | 0 | 2 | 0 | 0 | ||
| 2005 | 144 | 0 | 1 | 0 | 0 | 0 | 2 | 0 | 0 | 0 | 0 | |
| 2006 | 0 | 0 | 0 | 1 | 0 | 0 | 0 | 0 | 0 | 1 | 0 | 0 |
| 2007 | 0 | 1 | 1 | 4 | 3 | 1 | 8 | 3 | 1 | 10 | 3 | |
| 2008 | 3 | 1 | 8 | 5 | 1 | 1 | 2 | 2 | 5 | 0 | 0 | 0 |
| 2009 | 0 | 0 | 0 | 0 | 2 | 3 | 4 | 3 | 6 | 2 | 9 | 1 |
| 2010 | 4 | 1 | 0 | 2 | 4 | 3 | 8 | 3 | 3 | 4 | 3 | 2 |
| 2011 | 1 | 6 | 8 | 2 | 1 | 1 | 6 | 1 | 8 | 2 | 5 | 1 |
| 2012 | 4 | 2 | 5 | 4 | 3 | 3 | 1 | 1 | 1 | 2 | 4 | 5 |
| 2013 | 5 | 4 | 13 | 4 | 4 | 4 | 1 | 2 | 4 | 5 | 2 | 4 |
| 2014 | 13 | 9 | 6 | 1 | 4 | 6 | 10 | 7 | 3 | 4 | 2 | 2 |
| 2015 | 314 | 4 | 262 | 2 | 9 | 316 | 3 | 283 | 3 | 1 | 4 | 4 |
| 2016 | 8 | 18 | 3 | 5 | 2 | 6 | 3 | 150 | 1 | 2 | 5 | 4 |
| 2017 | 11 | 49 | 596 | 3 | 244 | 6 | 3 | 3 | 7 | 3 | 1 | 1 |
| 2018 | 8 | 21 | 14 | 3 | 3 | 32 | 3 | 2 | 2 | 29 | 4 | 1 |
| 2019 | 2 | 1 | 4 | 6 | 34 | 5 | 3 | 562 | 1 | 1 | 5 | 11 |
| 2020 | 483 | 5 | 87 | 33 | 633 | 391 | 561 | 693 | 1 | 1 | 1 | 6 |
| 2021 | 560 | 5 | 572 | 4 | 1,071 | 7 | 555 | 545 | 4 | 7 | 6 | 570 |
| 2022 | 30 | 4 | 542 | 541 | 1,075 | 12 | 1 | 783 | 8 | 3 | 1 | 58 |
| 2023 | 1 | 0 | 1 | 2 | 2 | 1 | 5 | 1 | 4 | 567 | 2 | 3 |
| 2024 | 6 | |||||||||||
| - = No Data Reported; -- = Not Applicable; NA = Not Available; W = Withheld to avoid disclosure of individual company data. |
| Release Date: 3/29/2024 |
| Next Release Date: 4/30/2024 |