|
Download Data (XLS File) |
|
||||||||
|
||||||||
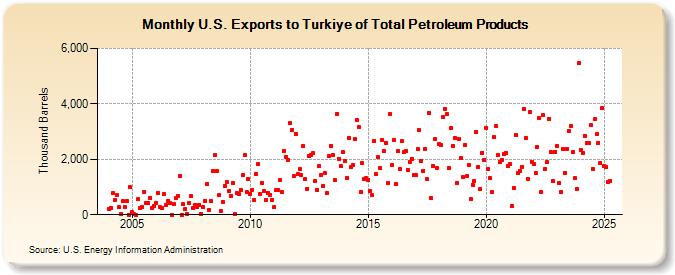
| U.S. Exports to Turkiye of Total Petroleum Products (Thousand Barrels) | ||||||||
| Year | Jan | Feb | Mar | Apr | May | Jun | Jul | Aug | Sep | Oct | Nov | Dec |
|---|---|---|---|---|---|---|---|---|---|---|---|---|
| 2004 | 223 | 245 | 767 | 530 | 727 | 270 | 18 | 502 | 270 | 497 | 0 | 984 |
| 2005 | 91 | 9 | 0 | 551 | 231 | 281 | 822 | 421 | 418 | 616 | 254 | 309 |
| 2006 | 439 | 799 | 271 | 255 | 742 | 348 | 511 | 411 | 7 | 394 | 595 | 681 |
| 2007 | 1,409 | 0 | 375 | 215 | 18 | 431 | 658 | 248 | 354 | 282 | 362 | 32 |
| 2008 | 281 | 512 | 1,102 | 176 | 494 | 1,559 | 2,156 | 1,592 | 694 | 130 | 459 | 1,039 |
| 2009 | 1,170 | 858 | 687 | 1,142 | 18 | 776 | 735 | 902 | 1,419 | 2,140 | 828 | 1,283 |
| 2010 | 750 | 893 | 526 | 1,479 | 1,816 | 742 | 1,156 | 845 | 532 | 800 | 713 | 548 |
| 2011 | 267 | 880 | 884 | 1,240 | 831 | 2,290 | 2,095 | 1,981 | 3,293 | 3,049 | 1,398 | 2,922 |
| 2012 | 1,467 | 1,638 | 1,426 | 2,479 | 1,280 | 944 | 2,104 | 2,164 | 2,215 | 1,215 | 890 | 1,768 |
| 2013 | 1,418 | 1,049 | 1,508 | 786 | 2,112 | 2,493 | 2,155 | 1,249 | 3,639 | 2,021 | 1,749 | 2,251 |
| 2014 | 1,928 | 1,333 | 2,759 | 1,715 | 1,776 | 2,740 | 3,417 | 3,150 | 815 | 1,872 | 1,305 | 1,313 |
| 2015 | 1,266 | 862 | 721 | 2,655 | 1,451 | 2,074 | 1,680 | 2,708 | 2,289 | 2,602 | 1,137 | 3,636 |
| 2016 | 1,807 | 2,699 | 1,101 | 2,290 | 1,636 | 2,643 | 2,257 | 2,293 | 1,610 | 1,900 | 2,027 | 1,423 |
| 2017 | 1,438 | 2,356 | 3,043 | 1,927 | 1,580 | 2,375 | 1,276 | 3,665 | 596 | 1,761 | 2,730 | 1,681 |
| 2018 | 2,550 | 2,498 | 3,508 | 3,825 | 3,624 | 1,686 | 3,114 | 2,486 | 2,776 | 1,149 | 2,736 | 2,034 |
| 2019 | 1,349 | 2,512 | 1,389 | 1,794 | 564 | 1,081 | 1,210 | 3,000 | 1,717 | 912 | 2,227 | 1,991 |
| 2020 | 3,131 | 1,655 | 1,326 | 831 | 2,803 | 3,194 | 2,167 | 1,906 | 1,985 | 2,200 | 2,244 | 1,766 |
| 2021 | 1,812 | 322 | 956 | 2,886 | 1,514 | 1,579 | 1,731 | 3,831 | 2,778 | 1,297 | 3,713 | 1,919 |
| 2022 | 1,813 | 1,500 | 2,452 | 3,477 | 825 | 3,606 | 1,663 | 1,887 | 3,467 | 2,253 | 1,202 | 2,280 |
| 2023 | 2,490 | 1,148 | 836 | 2,377 | 1,517 | 2,373 | 3,026 | 3,187 | 2,249 | 1,309 | 925 | 5,464 |
| 2024 | 2,351 | 2,232 | 2,852 | 2,570 | 2,598 | 3,222 | 1,652 | 3,436 | 2,902 | 2,602 | 1,879 | 3,852 |
| 2025 | 1,761 | 1,716 | 1,175 | 1,219 | ||||||||
| - = No Data Reported; -- = Not Applicable; NA = Not Available; W = Withheld to avoid disclosure of individual company data. |
| Release Date: 6/30/2025 |
| Next Release Date: 7/31/2025 |