|
Download Data (XLS File) |
|
||||||||
|
||||||||
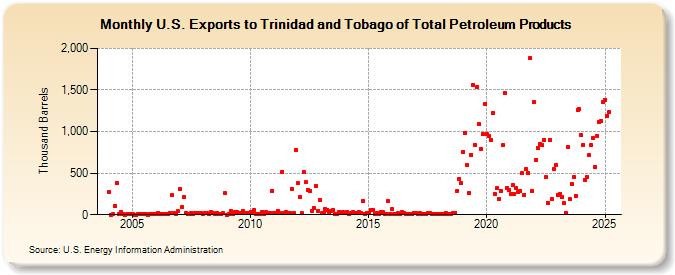
| U.S. Exports to Trinidad and Tobago of Total Petroleum Products (Thousand Barrels) | ||||||||
| Year | Jan | Feb | Mar | Apr | May | Jun | Jul | Aug | Sep | Oct | Nov | Dec |
|---|---|---|---|---|---|---|---|---|---|---|---|---|
| 2004 | 277 | 2 | 3 | 105 | 382 | 3 | 32 | 5 | 2 | 5 | 5 | 12 |
| 2005 | 3 | 2 | 2 | 6 | 5 | 4 | 6 | 6 | 2 | 5 | 9 | 3 |
| 2006 | 9 | 26 | 5 | 4 | 8 | 6 | 3 | 26 | 237 | 18 | 6 | 40 |
| 2007 | 306 | 91 | 208 | 20 | 4 | 4 | 25 | 5 | 17 | 22 | 15 | 21 |
| 2008 | 13 | 22 | 16 | 4 | 27 | 21 | 5 | 23 | 3 | 11 | 19 | 258 |
| 2009 | 2 | 6 | 47 | 4 | 30 | 32 | 20 | 22 | 43 | 26 | 22 | 26 |
| 2010 | 28 | 17 | 56 | 6 | 13 | 14 | 38 | 6 | 35 | 23 | 23 | 288 |
| 2011 | 20 | 17 | 42 | 19 | 519 | 25 | 33 | 26 | 24 | 315 | 16 | 782 |
| 2012 | 376 | 212 | 18 | 513 | 388 | 302 | 287 | 45 | 83 | 343 | 43 | 177 |
| 2013 | 20 | 23 | 67 | 60 | 29 | 39 | 54 | 13 | 9 | 38 | 17 | 29 |
| 2014 | 16 | 34 | 12 | 21 | 31 | 20 | 24 | 36 | 17 | 163 | 14 | 26 |
| 2015 | 19 | 54 | 58 | 14 | 16 | 8 | 34 | 35 | 14 | 14 | 165 | 12 |
| 2016 | 67 | 7 | 6 | 16 | 3 | 27 | 17 | 6 | 5 | 6 | 5 | 24 |
| 2017 | 19 | 14 | 20 | 5 | 6 | 11 | 24 | 21 | 4 | 7 | 6 | 14 |
| 2018 | 6 | 4 | 14 | 24 | 11 | 5 | 14 | 15 | 24 | 286 | 429 | 380 |
| 2019 | 759 | 987 | 594 | 264 | 724 | 1,561 | 843 | 1,539 | 1,089 | 791 | 972 | 1,335 |
| 2020 | 970 | 943 | 903 | 1,223 | 252 | 318 | 183 | 286 | 835 | 1,461 | 321 | 299 |
| 2021 | 246 | 359 | 246 | 316 | 275 | 285 | 496 | 241 | 545 | 497 | 1,890 | 283 |
| 2022 | 1,355 | 663 | 798 | 856 | 836 | 901 | 450 | 146 | 901 | 183 | 552 | 599 |
| 2023 | 242 | 249 | 210 | 136 | 25 | 815 | 184 | 372 | 456 | 226 | 1,262 | 1,273 |
| 2024 | 953 | 837 | 422 | 453 | 715 | 834 | 924 | 572 | 948 | 1,116 | 1,126 | 1,361 |
| 2025 | 1,382 | 1,190 | 1,232 | 942 | ||||||||
| - = No Data Reported; -- = Not Applicable; NA = Not Available; W = Withheld to avoid disclosure of individual company data. |
| Release Date: 6/30/2025 |
| Next Release Date: 7/31/2025 |