|
Download Data (XLS File) |
|
||||||||
|
||||||||
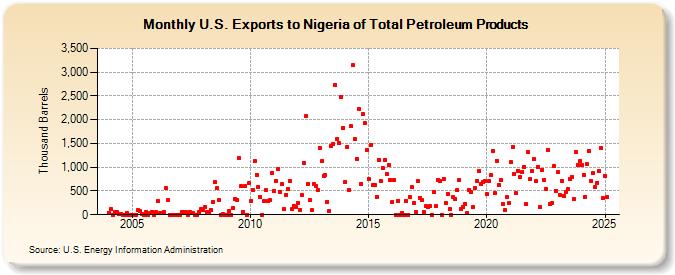
| U.S. Exports to Nigeria of Total Petroleum Products (Thousand Barrels) | ||||||||
| Year | Jan | Feb | Mar | Apr | May | Jun | Jul | Aug | Sep | Oct | Nov | Dec |
|---|---|---|---|---|---|---|---|---|---|---|---|---|
| 2004 | 46 | 118 | 4 | 55 | 47 | 24 | 5 | 3 | 1 | 36 | 1 | 1 |
| 2005 | 1 | 1 | 1 | 92 | 71 | 18 | 2 | 58 | 4 | 32 | 64 | 2 |
| 2006 | 51 | 288 | 27 | 35 | 48 | 553 | 300 | 2 | 2 | 2 | 2 | 2 |
| 2007 | 4 | 48 | 65 | 62 | 3 | 61 | 31 | 34 | 4 | 2 | 59 | 123 |
| 2008 | 100 | 170 | 62 | 48 | 98 | 278 | 686 | 556 | 316 | 2 | 5 | 4 |
| 2009 | 3 | 88 | 2 | 139 | 336 | 310 | 1,193 | 594 | 65 | 596 | 1 | 666 |
| 2010 | 281 | 522 | 1,132 | 844 | 593 | 369 | 2 | 286 | 510 | 282 | 309 | 886 |
| 2011 | 505 | 717 | 955 | 486 | 645 | 117 | 421 | 547 | 707 | 119 | 189 | 161 |
| 2012 | 250 | 107 | 415 | 1,091 | 2,068 | 646 | 311 | 90 | 642 | 612 | 521 | 1,406 |
| 2013 | 1,125 | 812 | 831 | 276 | 75 | 1,452 | 1,496 | 2,732 | 1,597 | 1,501 | 2,481 | 1,834 |
| 2014 | 685 | 1,431 | 524 | 1,857 | 3,141 | 1,597 | 1,172 | 2,220 | 652 | 2,116 | 1,932 | 1,361 |
| 2015 | 755 | 1,474 | 616 | 617 | 383 | 1,156 | 709 | 983 | 1,151 | 857 | 1,049 | 723 |
| 2016 | 268 | 740 | 2 | 295 | 1 | 37 | 2 | 298 | 1 | 377 | 575 | 247 |
| 2017 | 60 | 701 | 358 | 301 | 48 | 178 | 171 | 179 | 2 | 479 | 176 | 739 |
| 2018 | 718 | 2 | 754 | 254 | 442 | 120 | 2 | 366 | 331 | 517 | 736 | 128 |
| 2019 | 162 | 232 | 33 | 523 | 468 | 154 | 569 | 712 | 917 | 656 | 692 | 708 |
| 2020 | 441 | 704 | 827 | 1,346 | 449 | 1,136 | 626 | 726 | 225 | 92 | 363 | 242 |
| 2021 | 1,102 | 1,426 | 852 | 449 | 922 | 802 | 904 | 1,007 | 225 | 1,310 | 750 | 927 |
| 2022 | 1,172 | 702 | 1,009 | 161 | 947 | 732 | 538 | 1,370 | 230 | 239 | 1,035 | 509 |
| 2023 | 892 | 419 | 714 | 402 | 477 | 543 | 1,081 | 555 | 328 | 1,318 | 1,051 | 1,125 |
| 2024 | 1,045 | 843 | 376 | 1,057 | ||||||||
| - = No Data Reported; -- = Not Applicable; NA = Not Available; W = Withheld to avoid disclosure of individual company data. |
| Release Date: 6/28/2024 |
| Next Release Date: 7/31/2024 |