|
Download Data (XLS File) |
|
||||||||
|
||||||||
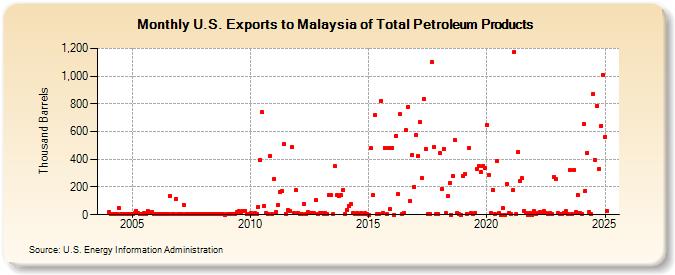
| U.S. Exports to Malaysia of Total Petroleum Products (Thousand Barrels) | ||||||||
| Year | Jan | Feb | Mar | Apr | May | Jun | Jul | Aug | Sep | Oct | Nov | Dec |
|---|---|---|---|---|---|---|---|---|---|---|---|---|
| 2004 | 18 | 5 | 6 | 6 | 4 | 52 | 4 | 6 | 5 | 5 | 4 | 3 |
| 2005 | 6 | 9 | 29 | 11 | 7 | 4 | 10 | 5 | 24 | 10 | 21 | 3 |
| 2006 | 2 | 2 | 4 | 2 | 5 | 4 | 8 | 138 | 5 | 3 | 116 | 2 |
| 2007 | 6 | 5 | 71 | 2 | 3 | 5 | 5 | 5 | 6 | 6 | 6 | 4 |
| 2008 | 3 | 3 | 6 | 3 | 5 | 4 | 5 | 4 | 3 | 4 | 5 | 1 |
| 2009 | 2 | 3 | 3 | 5 | 3 | 16 | 25 | 18 | 25 | 30 | 5 | 4 |
| 2010 | 14 | 5 | 10 | 6 | 58 | 396 | 739 | 63 | 10 | 4 | 427 | 3 |
| 2011 | 261 | 18 | 69 | 163 | 170 | 510 | 7 | 35 | 28 | 488 | 10 | 176 |
| 2012 | 13 | 5 | 5 | 79 | 6 | 17 | 13 | 9 | 14 | 105 | 5 | 10 |
| 2013 | 11 | 3 | 11 | 5 | 145 | 139 | 4 | 349 | 144 | 134 | 140 | 181 |
| 2014 | 5 | 37 | 60 | 76 | 11 | 5 | 11 | 3 | 10 | 3 | 9 | 7 |
| 2015 | 1 | 479 | 139 | 720 | 3 | 2 | 819 | 14 | 482 | 2 | 484 | 38 |
| 2016 | 482 | 1 | 570 | 148 | 726 | 2 | 9 | 609 | 778 | 98 | 431 | 202 |
| 2017 | 575 | 427 | 667 | 266 | 837 | 474 | 8 | 2 | 1,101 | 490 | 3 | 2 |
| 2018 | 444 | 184 | 475 | 10 | 132 | 227 | 1 | 279 | 537 | 13 | 2 | 1 |
| 2019 | 280 | 293 | 2 | 484 | 12 | 2 | 14 | 329 | 351 | 306 | 352 | 335 |
| 2020 | 646 | 289 | 11 | 178 | 2 | 386 | 10 | 1 | 46 | 1 | 218 | 11 |
| 2021 | 2 | 175 | 1,175 | 3 | 453 | 242 | 263 | 25 | 12 | 1 | 10 | 1 |
| 2022 | 24 | 2 | 12 | 16 | 15 | 24 | 12 | 4 | 12 | 2 | 275 | 255 |
| 2023 | 9 | 2 | 3 | 14 | 24 | 305 | 21 | 2 | 326 | 17 | 3 | 15 |
| 2024 | 3 | |||||||||||
| - = No Data Reported; -- = Not Applicable; NA = Not Available; W = Withheld to avoid disclosure of individual company data. |
| Release Date: 3/29/2024 |
| Next Release Date: 4/30/2024 |