|
Download Data (XLS File) |
|
||||||||
|
||||||||
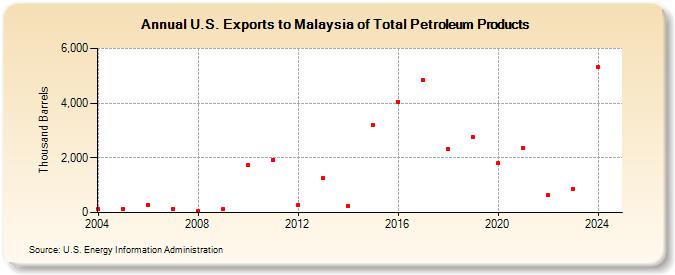
| U.S. Exports to Malaysia of Total Petroleum Products (Thousand Barrels) | ||||||||
| Decade | Year-0 | Year-1 | Year-2 | Year-3 | Year-4 | Year-5 | Year-6 | Year-7 | Year-8 | Year-9 |
|---|---|---|---|---|---|---|---|---|---|---|
| 2000's | 118 | 140 | 291 | 122 | 47 | 139 | ||||
| 2010's | 1,734 | 1,935 | 282 | 1,267 | 237 | 3,184 | 4,054 | 4,852 | 2,305 | 2,761 |
| 2020's | 1,800 | 2,363 | 653 | 741 |
| - = No Data Reported; -- = Not Applicable; NA = Not Available; W = Withheld to avoid disclosure of individual company data. |
| Release Date: 3/29/2024 |
| Next Release Date: 8/30/2024 |