|
Download Data (XLS File) |
|
||||||||
|
||||||||
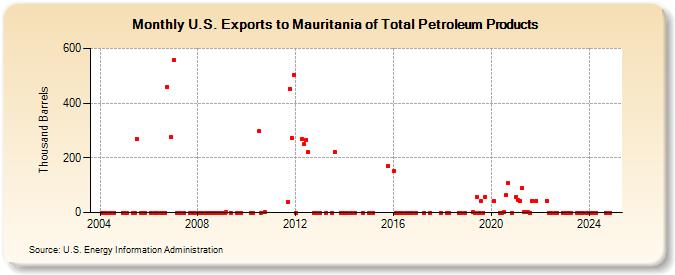
| U.S. Exports to Mauritania of Total Petroleum Products (Thousand Barrels) | ||||||||
| Year | Jan | Feb | Mar | Apr | May | Jun | Jul | Aug | Sep | Oct | Nov | Dec |
|---|---|---|---|---|---|---|---|---|---|---|---|---|
| 2004 | 0 | 0 | 0 | 0 | 0 | 0 | ||||||
| 2005 | 0 | 0 | 0 | 0 | 270 | 0 | 0 | 0 | ||||
| 2006 | 0 | 0 | 0 | 0 | 0 | 0 | 460 | 275 | ||||
| 2007 | 558 | 0 | 0 | 0 | 0 | 0 | 0 | |||||
| 2008 | 0 | 0 | 0 | 0 | 0 | 0 | 0 | 0 | 0 | 0 | 0 | |
| 2009 | 0 | 0 | 1 | 0 | 0 | 0 | ||||||
| 2010 | 0 | 0 | 298 | 0 | 1 | |||||||
| 2011 | 40 | 453 | 274 | 504 | ||||||||
| 2012 | 0 | 269 | 250 | 267 | 221 | 0 | 0 | |||||
| 2013 | 0 | 0 | 0 | 222 | 0 | 0 | ||||||
| 2014 | 0 | 0 | 0 | 0 | 0 | |||||||
| 2015 | 0 | 0 | 170 | |||||||||
| 2016 | 151 | 0 | 0 | 0 | 0 | 0 | 0 | 0 | 0 | 0 | ||
| 2017 | 0 | 0 | 0 | |||||||||
| 2018 | 0 | 0 | 0 | 0 | 0 | |||||||
| 2019 | 2 | 0 | 56 | 0 | 44 | 0 | 57 | |||||
| 2020 | 44 | 0 | 0 | 1 | 64 | 107 | 0 | |||||
| 2021 | 57 | 45 | 44 | 89 | 3 | 3 | 1 | 0 | 44 | 44 | ||
| 2022 | 44 | 0 | 0 | 0 | 0 | 0 | ||||||
| 2023 | 0 | 0 | 0 | 0 | 0 | 0 | 0 | 0 | 0 | |||
| 2024 | 0 | 0 | 0 | 0 | ||||||||
| - = No Data Reported; -- = Not Applicable; NA = Not Available; W = Withheld to avoid disclosure of individual company data. |
| Release Date: 8/30/2024 |
| Next Release Date: 9/30/2024 |