|
Download Data (XLS File) |
|
||||||||
|
||||||||
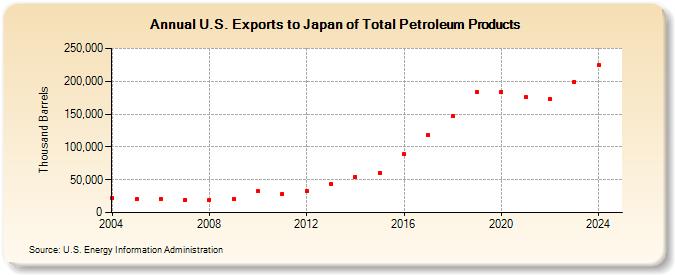
| U.S. Exports to Japan of Total Petroleum Products (Thousand Barrels) | ||||||||
| Decade | Year-0 | Year-1 | Year-2 | Year-3 | Year-4 | Year-5 | Year-6 | Year-7 | Year-8 | Year-9 |
|---|---|---|---|---|---|---|---|---|---|---|
| 2000's | 22,882 | 20,542 | 21,050 | 19,730 | 19,649 | 21,237 | ||||
| 2010's | 32,263 | 28,846 | 32,581 | 42,843 | 54,682 | 60,622 | 88,697 | 118,303 | 146,597 | 183,778 |
| 2020's | 184,052 | 175,239 | 173,153 | 210,608 |
| - = No Data Reported; -- = Not Applicable; NA = Not Available; W = Withheld to avoid disclosure of individual company data. |
| Release Date: 6/28/2024 |
| Next Release Date: 8/30/2024 |