|
Download Data (XLS File) |
|
||||||||
|
||||||||
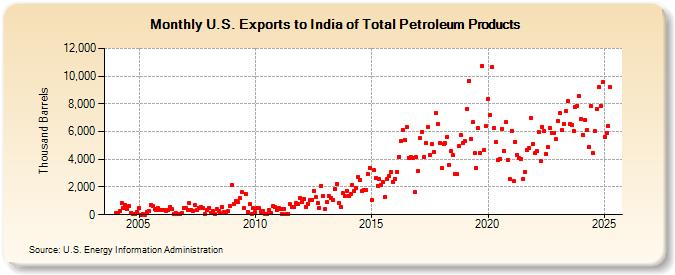
| U.S. Exports to India of Total Petroleum Products (Thousand Barrels) | ||||||||
| Year | Jan | Feb | Mar | Apr | May | Jun | Jul | Aug | Sep | Oct | Nov | Dec |
|---|---|---|---|---|---|---|---|---|---|---|---|---|
| 2004 | 114 | 105 | 269 | 833 | 459 | 728 | 447 | 606 | 139 | 67 | 46 | 230 |
| 2005 | 477 | 3 | 73 | 4 | 220 | 266 | 735 | 598 | 428 | 311 | 460 | 374 |
| 2006 | 352 | 365 | 283 | 323 | 551 | 401 | 42 | 106 | 28 | 16 | 102 | 509 |
| 2007 | 456 | 350 | 816 | 350 | 281 | 678 | 357 | 507 | 553 | 455 | 23 | 373 |
| 2008 | 502 | 156 | 271 | 28 | 429 | 279 | 123 | 540 | 182 | 200 | 245 | 617 |
| 2009 | 2,118 | 795 | 998 | 888 | 1,170 | 1,614 | 468 | 1,524 | 225 | 743 | 83 | 471 |
| 2010 | 183 | 486 | 456 | 183 | 287 | 17 | 51 | 360 | 137 | 607 | 549 | 359 |
| 2011 | 459 | 438 | 47 | 436 | 38 | 26 | 740 | 555 | 569 | 868 | 757 | 1,204 |
| 2012 | 923 | 1,137 | 578 | 798 | 1,028 | 1,089 | 1,741 | 1,254 | 863 | 505 | 2,097 | 1,339 |
| 2013 | 419 | 912 | 1,324 | 1,173 | 1,047 | 1,874 | 2,210 | 841 | 566 | 1,580 | 1,339 | 1,719 |
| 2014 | 1,384 | 1,468 | 2,173 | 1,708 | 1,924 | 2,727 | 2,536 | 1,706 | 1,771 | 1,788 | 2,952 | 3,394 |
| 2015 | 1,046 | 3,192 | 2,620 | 2,097 | 2,561 | 2,168 | 2,339 | 1,261 | 2,599 | 2,764 | 3,104 | 2,388 |
| 2016 | 2,611 | 3,096 | 4,194 | 5,326 | 6,142 | 5,417 | 6,362 | 4,114 | 4,143 | 4,114 | 1,619 | 4,139 |
| 2017 | 3,171 | 5,502 | 5,969 | 4,192 | 5,155 | 6,330 | 4,327 | 5,100 | 4,547 | 7,343 | 6,518 | 5,185 |
| 2018 | 3,372 | 5,120 | 5,149 | 5,625 | 3,578 | 4,563 | 4,306 | 2,948 | 2,902 | 4,940 | 5,716 | 5,192 |
| 2019 | 5,319 | 7,658 | 9,649 | 5,469 | 6,656 | 4,429 | 3,376 | 6,222 | 4,447 | 10,757 | 4,675 | 6,378 |
| 2020 | 8,377 | 7,180 | 10,674 | 6,265 | 5,243 | 3,944 | 3,996 | 6,220 | 4,573 | 6,666 | 3,967 | 2,561 |
| 2021 | 6,067 | 2,401 | 5,279 | 4,325 | 4,063 | 4,015 | 2,599 | 3,106 | 4,658 | 4,781 | 6,956 | 5,072 |
| 2022 | 4,420 | 4,601 | 5,933 | 3,848 | 6,344 | 6,045 | 4,414 | 4,885 | 6,244 | 5,919 | 5,928 | 5,447 |
| 2023 | 6,043 | 7,657 | 6,571 | 6,693 | 6,833 | 8,297 | 6,362 | 5,915 | 6,230 | 7,442 | 7,538 | 8,517 |
| 2024 | 6,903 | |||||||||||
| - = No Data Reported; -- = Not Applicable; NA = Not Available; W = Withheld to avoid disclosure of individual company data. |
| Release Date: 3/29/2024 |
| Next Release Date: 4/30/2024 |