|
Download Data (XLS File) |
|
||||||||
|
||||||||
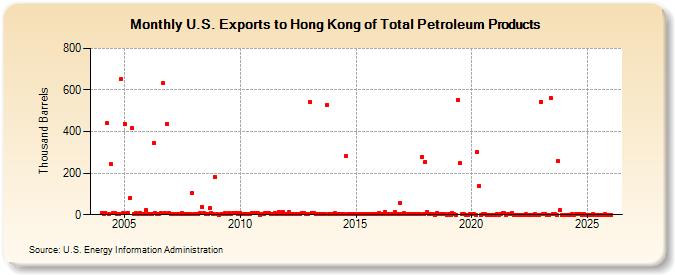
| U.S. Exports to Hong Kong of Total Petroleum Products (Thousand Barrels) | ||||||||
| Year | Jan | Feb | Mar | Apr | May | Jun | Jul | Aug | Sep | Oct | Nov | Dec |
|---|---|---|---|---|---|---|---|---|---|---|---|---|
| 2004 | 7 | 3 | 10 | 441 | 5 | 242 | 8 | 6 | 3 | 5 | 651 | 6 |
| 2005 | 438 | 7 | 8 | 82 | 415 | 4 | 7 | 5 | 8 | 4 | 3 | 22 |
| 2006 | 3 | 4 | 4 | 346 | 6 | 4 | 3 | 6 | 635 | 6 | 437 | 8 |
| 2007 | 4 | 3 | 4 | 3 | 3 | 5 | 8 | 4 | 4 | 3 | 3 | 104 |
| 2008 | 2 | 3 | 3 | 6 | 38 | 6 | 3 | 2 | 31 | 7 | 4 | 181 |
| 2009 | 2 | 1 | 2 | 2 | 7 | 4 | 9 | 3 | 7 | 8 | 7 | 2 |
| 2010 | 10 | 2 | 4 | 4 | 4 | 5 | 7 | 7 | 6 | 6 | 1 | 3 |
| 2011 | 2 | 8 | 8 | 8 | 4 | 2 | 7 | 2 | 14 | 2 | 11 | 4 |
| 2012 | 3 | 11 | 3 | 2 | 3 | 3 | 4 | 2 | 8 | 10 | 4 | 5 |
| 2013 | 543 | 10 | 7 | 5 | 2 | 2 | 3 | 4 | 5 | 528 | 4 | 4 |
| 2014 | 4 | 6 | 2 | 5 | 3 | 4 | 2 | 281 | 2 | 4 | 2 | 5 |
| 2015 | 3 | 4 | 2 | 2 | 2 | 4 | 3 | 2 | 2 | 3 | 3 | 2 |
| 2016 | 7 | 3 | 2 | 13 | 4 | 3 | 2 | 5 | 11 | 4 | 4 | 56 |
| 2017 | 3 | 6 | 4 | 3 | 3 | 5 | 4 | 2 | 4 | 3 | 278 | 4 |
| 2018 | 254 | 11 | 4 | 3 | 2 | 1 | 6 | 2 | 2 | 2 | 2 | 1 |
| 2019 | 2 | 1 | 6 | 2 | 1 | 553 | 248 | 3 | 2 | 1 | 1 | 2 |
| 2020 | 2 | 2 | 1 | 302 | 139 | 1 | 4 | 2 | 1 | 1 | 1 | 1 |
| 2021 | 1 | 2 | 1 | 4 | 6 | 6 | 1 | 3 | 2 | 7 | 1 | 1 |
| 2022 | 1 | 1 | 1 | 1 | 2 | 1 | 1 | 1 | 1 | 2 | 1 | 0 |
| 2023 | 599 | 2 | 5 | 1 | 1 | 1 | 2 | 2 | 1 | 258 | 21 | 1 |
| 2024 | 0 | |||||||||||
| - = No Data Reported; -- = Not Applicable; NA = Not Available; W = Withheld to avoid disclosure of individual company data. |
| Release Date: 3/29/2024 |
| Next Release Date: 4/30/2024 |