|
Download Data (XLS File) |
|
||||||||
|
||||||||
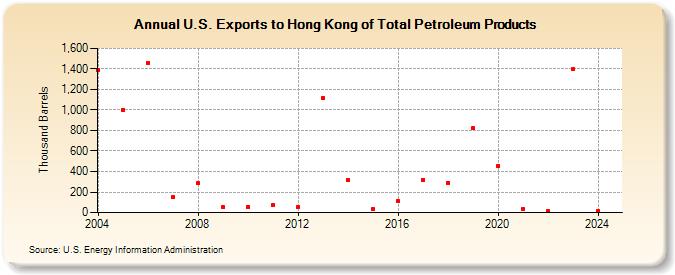
| U.S. Exports to Hong Kong of Total Petroleum Products (Thousand Barrels) | ||||||||
| Decade | Year-0 | Year-1 | Year-2 | Year-3 | Year-4 | Year-5 | Year-6 | Year-7 | Year-8 | Year-9 |
|---|---|---|---|---|---|---|---|---|---|---|
| 2000's | 1,387 | 1,003 | 1,462 | 147 | 285 | 54 | ||||
| 2010's | 59 | 72 | 56 | 1,118 | 322 | 31 | 113 | 320 | 292 | 821 |
| 2020's | 457 | 35 | 14 | 1,399 |
| - = No Data Reported; -- = Not Applicable; NA = Not Available; W = Withheld to avoid disclosure of individual company data. |
| Release Date: 8/30/2024 |
| Next Release Date: 8/29/2025 |