|
Download Data (XLS File) |
|
||||||||
|
||||||||
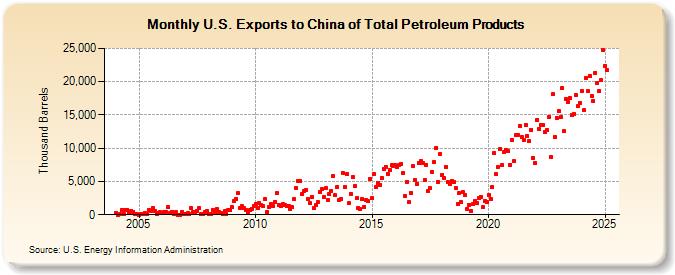
| U.S. Exports to China of Total Petroleum Products (Thousand Barrels) | ||||||||
| Year | Jan | Feb | Mar | Apr | May | Jun | Jul | Aug | Sep | Oct | Nov | Dec |
|---|---|---|---|---|---|---|---|---|---|---|---|---|
| 2004 | 322 | 32 | 46 | 717 | 159 | 636 | 757 | 247 | 633 | 424 | 91 | 47 |
| 2005 | 21 | 84 | 43 | 293 | 35 | 724 | 505 | 1,084 | 536 | 165 | 263 | 358 |
| 2006 | 219 | 449 | 460 | 1,152 | 228 | 434 | 77 | 394 | 27 | 27 | 466 | 52 |
| 2007 | 37 | 280 | 67 | 979 | 462 | 359 | 633 | 986 | 101 | 51 | 424 | 591 |
| 2008 | 118 | 53 | 776 | 372 | 908 | 428 | 231 | 78 | 505 | 97 | 637 | 671 |
| 2009 | 1,111 | 2,094 | 2,427 | 3,224 | 1,027 | 1,283 | 941 | 674 | 216 | 686 | 926 | 1,345 |
| 2010 | 1,652 | 1,027 | 1,703 | 1,413 | 1,252 | 2,293 | 432 | 1,097 | 1,630 | 1,254 | 1,923 | 3,217 |
| 2011 | 1,523 | 1,282 | 1,545 | 1,461 | 1,331 | 1,263 | 816 | 1,098 | 2,287 | 4,077 | 5,000 | 5,074 |
| 2012 | 3,116 | 3,582 | 3,683 | 2,353 | 1,719 | 2,694 | 985 | 1,398 | 1,862 | 3,374 | 3,801 | 2,609 |
| 2013 | 3,961 | 2,184 | 3,052 | 3,566 | 5,805 | 2,916 | 4,195 | 2,175 | 2,331 | 6,274 | 4,169 | 6,101 |
| 2014 | 1,698 | 3,165 | 5,666 | 4,249 | 2,467 | 1,026 | 842 | 2,333 | 1,198 | 2,211 | 2,007 | 5,420 |
| 2015 | 2,493 | 6,123 | 4,223 | 4,790 | 4,511 | 5,523 | 6,938 | 7,247 | 6,185 | 6,656 | 7,412 | 7,343 |
| 2016 | 7,416 | 7,201 | 7,490 | 7,649 | 6,257 | 2,845 | 4,956 | 1,850 | 3,314 | 7,274 | 5,286 | 4,642 |
| 2017 | 7,781 | 8,006 | 7,832 | 5,183 | 7,534 | 3,570 | 3,950 | 6,468 | 7,901 | 10,100 | 4,982 | 9,155 |
| 2018 | 5,978 | 5,446 | 7,242 | 4,899 | 4,627 | 5,064 | 4,970 | 4,028 | 1,570 | 3,311 | 1,873 | 3,349 |
| 2019 | 2,891 | 912 | 1,477 | 530 | 1,563 | 2,078 | 1,774 | 2,451 | 2,706 | 1,119 | 2,135 | 1,871 |
| 2020 | 3,032 | 2,389 | 4,140 | 9,246 | 6,054 | 7,235 | 9,883 | 7,453 | 9,379 | 9,731 | 9,539 | 7,519 |
| 2021 | 11,245 | 8,000 | 11,949 | 12,013 | 13,350 | 11,686 | 11,291 | 13,494 | 11,802 | 11,008 | 12,788 | 8,528 |
| 2022 | 7,761 | 14,239 | 12,846 | 13,550 | 13,470 | 12,494 | 12,673 | 14,715 | 8,658 | 18,079 | 11,700 | 14,579 |
| 2023 | 15,558 | 14,703 | 18,991 | 12,541 | 17,357 | 16,985 | 17,541 | 14,970 | 15,136 | 17,980 | 16,298 | 16,855 |
| 2024 | 18,549 | 15,682 | 20,570 | 18,550 | 20,863 | 17,794 | 17,066 | 21,349 | 19,811 | 18,628 | 20,210 | 24,708 |
| 2025 | 22,392 | 21,748 | 25,880 | 16,706 | ||||||||
| - = No Data Reported; -- = Not Applicable; NA = Not Available; W = Withheld to avoid disclosure of individual company data. |
| Release Date: 6/30/2025 |
| Next Release Date: 7/31/2025 |