|
Download Data (XLS File) |
|
||||||||
|
||||||||
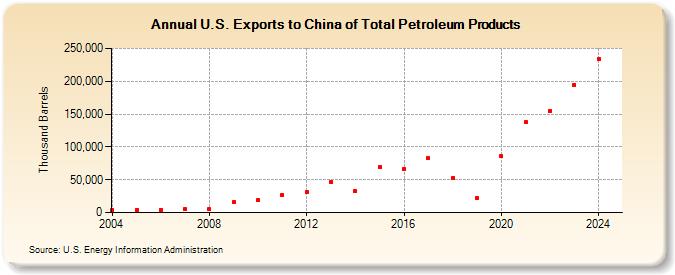
| U.S. Exports to China of Total Petroleum Products (Thousand Barrels) | ||||||||
| Decade | Year-0 | Year-1 | Year-2 | Year-3 | Year-4 | Year-5 | Year-6 | Year-7 | Year-8 | Year-9 |
|---|---|---|---|---|---|---|---|---|---|---|
| 2000's | 4,112 | 4,110 | 3,986 | 4,970 | 4,875 | 15,954 | ||||
| 2010's | 18,894 | 26,756 | 31,175 | 46,729 | 32,282 | 69,444 | 66,181 | 82,462 | 52,358 | 21,506 |
| 2020's | 85,600 | 137,155 | 154,765 | 191,578 |
| - = No Data Reported; -- = Not Applicable; NA = Not Available; W = Withheld to avoid disclosure of individual company data. |
| Release Date: 3/29/2024 |
| Next Release Date: 8/30/2024 |