|
Download Data (XLS File) |
|
||||||||
|
||||||||
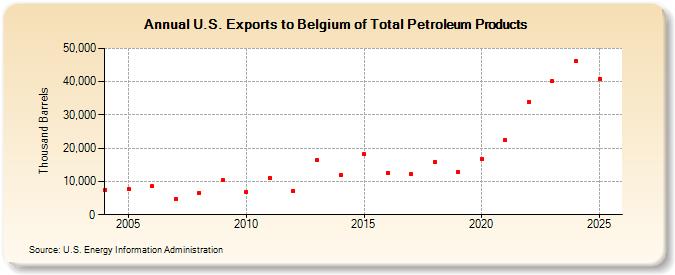
| U.S. Exports to Belgium of Total Petroleum Products (Thousand Barrels) | ||||||||
| Decade | Year-0 | Year-1 | Year-2 | Year-3 | Year-4 | Year-5 | Year-6 | Year-7 | Year-8 | Year-9 |
|---|---|---|---|---|---|---|---|---|---|---|
| 2000's | 7,396 | 7,595 | 8,510 | 4,609 | 6,625 | 10,414 | ||||
| 2010's | 6,963 | 11,117 | 7,142 | 16,511 | 11,915 | 18,149 | 12,679 | 12,155 | 15,907 | 12,954 |
| 2020's | 16,853 | 22,348 | 33,983 | 38,910 |
| - = No Data Reported; -- = Not Applicable; NA = Not Available; W = Withheld to avoid disclosure of individual company data. |
| Release Date: 6/28/2024 |
| Next Release Date: 8/30/2024 |