|
Download Data (XLS File) |
|
||||||||
|
||||||||
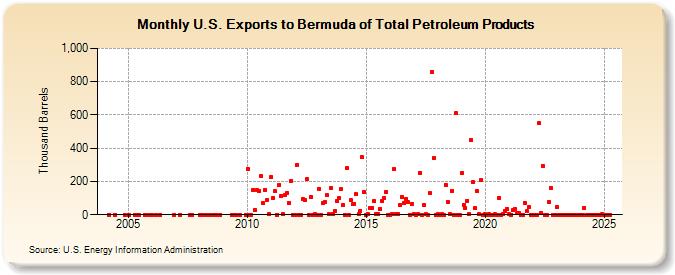
| U.S. Exports to Bermuda of Total Petroleum Products (Thousand Barrels) | ||||||||
| Year | Jan | Feb | Mar | Apr | May | Jun | Jul | Aug | Sep | Oct | Nov | Dec |
|---|---|---|---|---|---|---|---|---|---|---|---|---|
| 2004 | 0 | 0 | 0 | |||||||||
| 2005 | 0 | 0 | 0 | 0 | 0 | 0 | 0 | |||||
| 2006 | 0 | 0 | 0 | 0 | ||||||||
| 2007 | 0 | 0 | 0 | |||||||||
| 2008 | 0 | 0 | 0 | 0 | 0 | 0 | 0 | |||||
| 2009 | 0 | 0 | 0 | 0 | 0 | |||||||
| 2010 | 276 | 0 | 0 | 149 | 27 | 148 | 144 | 230 | 70 | 149 | 91 | 2 |
| 2011 | 228 | 103 | 141 | 0 | 180 | 114 | 2 | 120 | 131 | 72 | 202 | 1 |
| 2012 | 1 | 299 | 1 | 0 | 95 | 86 | 212 | 0 | 105 | 1 | 2 | 1 |
| 2013 | 155 | 1 | 72 | 79 | 116 | 2 | 162 | 2 | 21 | 82 | 100 | 153 |
| 2014 | 57 | 1 | 279 | 0 | 86 | 64 | 67 | 122 | 2 | 23 | 345 | 136 |
| 2015 | 1 | 2 | 43 | 42 | 80 | 2 | 2 | 37 | 82 | 99 | 139 | 1 |
| 2016 | 1 | 2 | 274 | 2 | 2 | 57 | 108 | 69 | 95 | 74 | 1 | 63 |
| 2017 | 2 | 1 | 2 | 253 | 1 | 60 | 3 | 1 | 130 | 857 | 342 | 1 |
| 2018 | 2 | 1 | 2 | 1 | 181 | 78 | 2 | 145 | 1 | 610 | 1 | 1 |
| 2019 | 250 | 61 | 40 | 84 | 3 | 449 | 194 | 39 | 141 | 2 | 209 | 1 |
| 2020 | 2 | 1 | 2 | 0 | 1 | 2 | 1 | 100 | 1 | 5 | 20 | 37 |
| 2021 | 2 | 1 | 26 | 36 | 9 | 9 | 1 | 1 | 73 | 20 | 45 | 0 |
| 2022 | 0 | 0 | 0 | 550 | 11 | 295 | 1 | 1 | 76 | 161 | 1 | 1 |
| 2023 | 45 | 1 | 1 | 1 | 1 | 1 | 0 | 1 | 1 | 1 | 0 | 1 |
| 2024 | 0 | |||||||||||
| - = No Data Reported; -- = Not Applicable; NA = Not Available; W = Withheld to avoid disclosure of individual company data. |
| Release Date: 3/29/2024 |
| Next Release Date: 4/30/2024 |