|
Download Data (XLS File) |
|
||||||||
|
||||||||
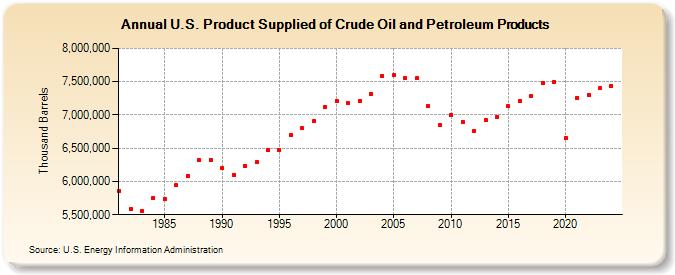
| U.S. Product Supplied of Crude Oil and Petroleum Products (Thousand Barrels) | ||||||||
| Decade | Year-0 | Year-1 | Year-2 | Year-3 | Year-4 | Year-5 | Year-6 | Year-7 | Year-8 | Year-9 |
|---|---|---|---|---|---|---|---|---|---|---|
| 1980's | 5,861,058 | 5,582,938 | 5,559,364 | 5,755,575 | 5,740,143 | 5,942,429 | 6,082,742 | 6,325,692 | 6,323,681 | |
| 1990's | 6,200,801 | 6,100,550 | 6,234,025 | 6,291,407 | 6,467,128 | 6,469,475 | 6,701,059 | 6,796,411 | 6,904,756 | 7,124,558 |
| 2000's | 7,210,594 | 7,171,777 | 7,212,876 | 7,312,229 | 7,587,601 | 7,592,789 | 7,550,907 | 7,548,338 | 7,136,255 | 6,851,561 |
| 2010's | 6,999,801 | 6,896,859 | 6,764,541 | 6,922,779 | 6,971,670 | 7,129,046 | 7,207,235 | 7,282,452 | 7,486,730 | 7,498,142 |
| 2020's | 6,656,043 | 7,259,806 | 7,303,725 | 7,400,380 | 7,432,402 |
| - = No Data Reported; -- = Not Applicable; NA = Not Available; W = Withheld to avoid disclosure of individual company data. |
| Release Date: 6/30/2025 |
| Next Release Date: 8/29/2025 |