|
Download Data (XLS File) |
|
||||||||
|
||||||||
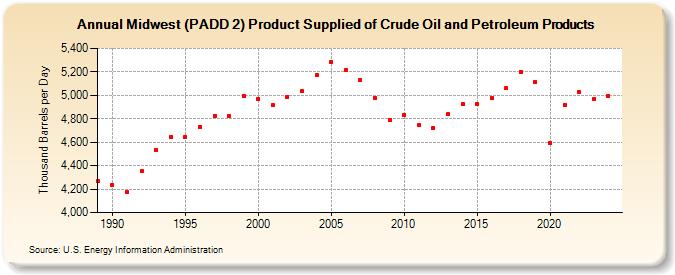
| Midwest (PADD 2) Product Supplied of Crude Oil and Petroleum Products (Thousand Barrels per Day) | ||||||||
| Decade | Year-0 | Year-1 | Year-2 | Year-3 | Year-4 | Year-5 | Year-6 | Year-7 | Year-8 | Year-9 |
|---|---|---|---|---|---|---|---|---|---|---|
| 1980's | 4,266 | |||||||||
| 1990's | 4,233 | 4,174 | 4,352 | 4,535 | 4,644 | 4,643 | 4,733 | 4,825 | 4,820 | 4,995 |
| 2000's | 4,971 | 4,913 | 4,989 | 5,034 | 5,175 | 5,285 | 5,214 | 5,129 | 4,977 | 4,788 |
| 2010's | 4,835 | 4,745 | 4,723 | 4,837 | 4,923 | 4,925 | 4,973 | 5,059 | 5,199 | 5,114 |
| 2020's | 4,597 | 4,918 | 5,028 | 4,981 |
| - = No Data Reported; -- = Not Applicable; NA = Not Available; W = Withheld to avoid disclosure of individual company data. |
| Release Date: 3/29/2024 |
| Next Release Date: 8/30/2024 |