|
Download Data (XLS File) |
|
||||||||
|
||||||||
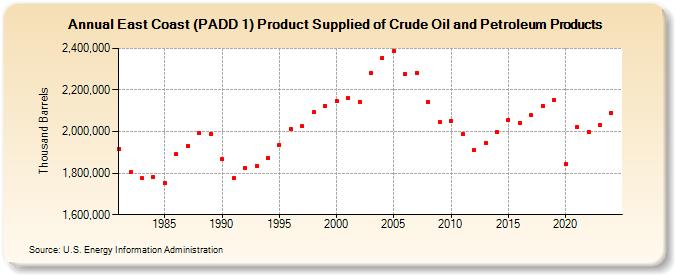
| East Coast (PADD 1) Product Supplied of Crude Oil and Petroleum Products (Thousand Barrels) | ||||||||
| Decade | Year-0 | Year-1 | Year-2 | Year-3 | Year-4 | Year-5 | Year-6 | Year-7 | Year-8 | Year-9 |
|---|---|---|---|---|---|---|---|---|---|---|
| 1980's | 1,916,204 | 1,803,779 | 1,775,346 | 1,782,750 | 1,750,617 | 1,891,814 | 1,932,706 | 1,993,435 | 1,988,200 | |
| 1990's | 1,866,277 | 1,776,364 | 1,822,417 | 1,836,409 | 1,872,129 | 1,935,733 | 2,011,956 | 2,024,716 | 2,092,561 | 2,123,452 |
| 2000's | 2,147,866 | 2,159,189 | 2,142,315 | 2,282,390 | 2,355,353 | 2,389,101 | 2,276,240 | 2,283,295 | 2,141,967 | 2,048,164 |
| 2010's | 2,051,603 | 1,987,817 | 1,912,079 | 1,945,913 | 1,997,985 | 2,057,121 | 2,043,053 | 2,077,786 | 2,123,417 | 2,154,131 |
| 2020's | 1,843,447 | 2,022,167 | 1,999,391 | 2,030,741 |
| - = No Data Reported; -- = Not Applicable; NA = Not Available; W = Withheld to avoid disclosure of individual company data. |
| Release Date: 3/29/2024 |
| Next Release Date: 8/30/2024 |