|
Download Data (XLS File) |
|
||||||||
|
||||||||
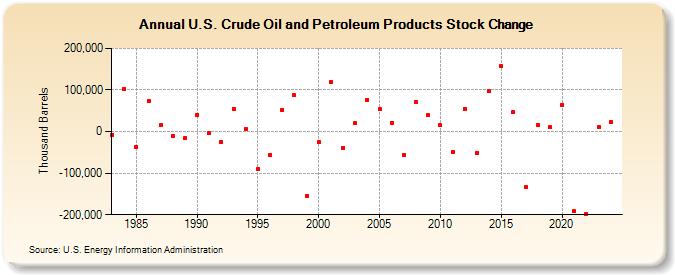
| U.S. Crude Oil and Petroleum Products Stock Change (Thousand Barrels) | ||||||||
| Decade | Year-0 | Year-1 | Year-2 | Year-3 | Year-4 | Year-5 | Year-6 | Year-7 | Year-8 | Year-9 |
|---|---|---|---|---|---|---|---|---|---|---|
| 1980's | -7,322 | 102,590 | -37,458 | 73,743 | 14,939 | -10,219 | -15,813 | |||
| 1990's | 39,214 | -3,679 | -24,980 | 55,245 | 5,566 | -89,933 | -55,436 | 52,343 | 87,216 | -154,044 |
| 2000's | -25,384 | 118,802 | -38,439 | 20,393 | 76,502 | 53,141 | 21,498 | -55,416 | 71,511 | 39,192 |
| 2010's | 15,360 | -50,330 | 55,326 | -50,544 | 97,416 | 157,268 | 45,842 | -132,885 | 16,076 | 10,320 |
| 2020's | 64,587 | -192,199 | -197,672 | 13,236 |
| - = No Data Reported; -- = Not Applicable; NA = Not Available; W = Withheld to avoid disclosure of individual company data. |
| Release Date: 3/29/2024 |
| Next Release Date: 8/30/2024 |