|
Download Data (XLS File) |
|
||||||||
|
||||||||
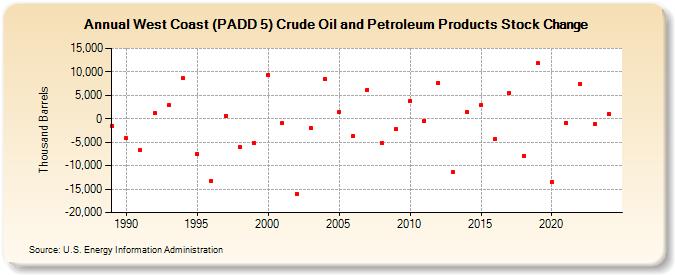
| West Coast (PADD 5) Crude Oil and Petroleum Products Stock Change (Thousand Barrels) | ||||||||
| Decade | Year-0 | Year-1 | Year-2 | Year-3 | Year-4 | Year-5 | Year-6 | Year-7 | Year-8 | Year-9 |
|---|---|---|---|---|---|---|---|---|---|---|
| 1980's | -1,532 | |||||||||
| 1990's | -4,200 | -6,720 | 1,148 | 2,855 | 8,671 | -7,442 | -13,265 | 685 | -6,104 | -5,133 |
| 2000's | 9,325 | -968 | -16,042 | -1,941 | 8,516 | 1,488 | -3,683 | 6,204 | -5,152 | -2,144 |
| 2010's | 3,887 | -386 | 7,718 | -11,412 | 1,525 | 2,944 | -4,407 | 5,495 | -7,940 | 11,831 |
| 2020's | -13,436 | -886 | 7,470 | -1,034 |
| - = No Data Reported; -- = Not Applicable; NA = Not Available; W = Withheld to avoid disclosure of individual company data. |
| Release Date: 3/29/2024 |
| Next Release Date: 8/30/2024 |