|
Download Data (XLS File) |
|
||||||||
|
||||||||
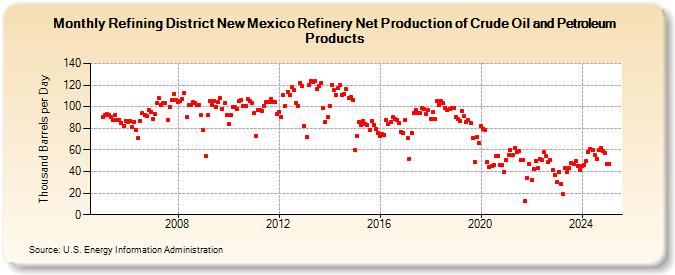
| Refining District New Mexico Refinery Net Production of Crude Oil and Petroleum Products (Thousand Barrels per Day) | ||||||||
| Year | Jan | Feb | Mar | Apr | May | Jun | Jul | Aug | Sep | Oct | Nov | Dec |
|---|---|---|---|---|---|---|---|---|---|---|---|---|
| 2005 | 90 | 92 | 93 | 92 | 90 | 88 | 92 | 88 | 88 | 85 | 82 | 87 |
| 2006 | 86 | 87 | 81 | 86 | 78 | 71 | 87 | 94 | 92 | 91 | 97 | 95 |
| 2007 | 89 | 93 | 103 | 108 | 102 | 103 | 103 | 88 | 100 | 106 | 112 | 106 |
| 2008 | 104 | 105 | 107 | 113 | 90 | 102 | 102 | 104 | 103 | 102 | 102 | 92 |
| 2009 | 78 | 54 | 92 | 105 | 102 | 105 | 100 | 104 | 108 | 98 | 103 | 92 |
| 2010 | 84 | 92 | 100 | 100 | 98 | 105 | 106 | 101 | 101 | 107 | 105 | 103 |
| 2011 | 94 | 73 | 97 | 97 | 96 | 101 | 104 | 104 | 107 | 104 | 104 | 93 |
| 2012 | 95 | 90 | 111 | 101 | 114 | 111 | 118 | 115 | 103 | 101 | 122 | 119 |
| 2013 | 82 | 72 | 120 | 124 | 123 | 124 | 116 | 119 | 122 | 99 | 86 | 90 |
| 2014 | 101 | 120 | 115 | 111 | 117 | 120 | 111 | 112 | 116 | 108 | 109 | 106 |
| 2015 | 60 | 73 | 86 | 83 | 87 | 84 | 83 | 78 | 87 | 83 | 79 | 76 |
| 2016 | 73 | 75 | 74 | 88 | 84 | 86 | 90 | 89 | 88 | 85 | 77 | 76 |
| 2017 | 88 | 71 | 52 | 76 | 94 | 97 | 94 | 94 | 99 | 98 | 93 | 97 |
| 2018 | 89 | 95 | 89 | 105 | 102 | 105 | 103 | 99 | 97 | 98 | 99 | 99 |
| 2019 | 90 | 89 | 87 | 96 | 91 | 86 | 88 | 85 | 71 | 49 | 72 | 66 |
| 2020 | 82 | 79 | 78 | 49 | 44 | 45 | 46 | 54 | 54 | 46 | 46 | 40 |
| 2021 | 51 | 55 | 60 | 55 | 62 | 58 | 59 | 51 | 51 | 13 | 34 | 47 |
| 2022 | 32 | 42 | 50 | 43 | 52 | 51 | 58 | 54 | 49 | 51 | 41 | 37 |
| 2023 | 30 | 40 | 28 | 19 | 43 | 40 | 43 | 48 | 47 | 50 | 45 | 41 |
| 2024 | 45 | |||||||||||
| - = No Data Reported; -- = Not Applicable; NA = Not Available; W = Withheld to avoid disclosure of individual company data. |
| Release Date: 3/29/2024 |
| Next Release Date: 4/30/2024 |