|
Download Data (XLS File) |
|
||||||||
|
||||||||
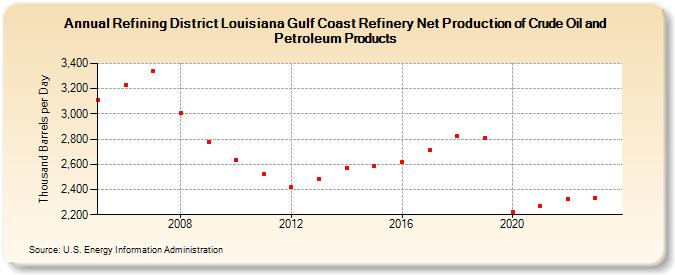
| Refining District Louisiana Gulf Coast Refinery Net Production of Crude Oil and Petroleum Products (Thousand Barrels per Day) | ||||||||
| Decade | Year-0 | Year-1 | Year-2 | Year-3 | Year-4 | Year-5 | Year-6 | Year-7 | Year-8 | Year-9 |
|---|---|---|---|---|---|---|---|---|---|---|
| 2000's | 3,110 | 3,228 | 3,339 | 3,007 | 2,779 | |||||
| 2010's | 2,633 | 2,523 | 2,416 | 2,485 | 2,570 | 2,587 | 2,621 | 2,713 | 2,822 | 2,812 |
| 2020's | 2,223 | 2,271 | 2,327 | 2,336 |
| - = No Data Reported; -- = Not Applicable; NA = Not Available; W = Withheld to avoid disclosure of individual company data. |
| Release Date: 3/29/2024 |
| Next Release Date: 8/30/2024 |