|
Download Data (XLS File) |
|
||||||||
|
||||||||
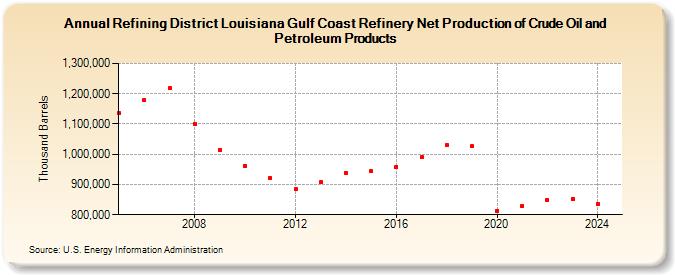
| Refining District Louisiana Gulf Coast Refinery Net Production of Crude Oil and Petroleum Products (Thousand Barrels) | ||||||||
| Decade | Year-0 | Year-1 | Year-2 | Year-3 | Year-4 | Year-5 | Year-6 | Year-7 | Year-8 | Year-9 |
|---|---|---|---|---|---|---|---|---|---|---|
| 2000's | 1,135,229 | 1,178,348 | 1,218,690 | 1,100,679 | 1,014,153 | |||||
| 2010's | 961,017 | 920,735 | 884,335 | 906,954 | 938,134 | 944,298 | 959,391 | 990,332 | 1,029,973 | 1,026,260 |
| 2020's | 813,587 | 828,887 | 849,189 | 852,636 |
| - = No Data Reported; -- = Not Applicable; NA = Not Available; W = Withheld to avoid disclosure of individual company data. |
| Release Date: 3/29/2024 |
| Next Release Date: 8/30/2024 |