|
Download Data (XLS File) |
|
||||||||
|
||||||||
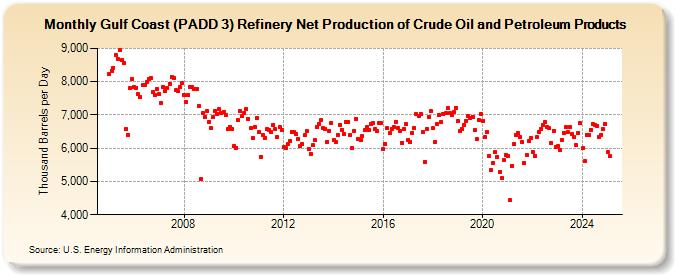
| Gulf Coast (PADD 3) Refinery Net Production of Crude Oil and Petroleum Products (Thousand Barrels per Day) | ||||||||
| Year | Jan | Feb | Mar | Apr | May | Jun | Jul | Aug | Sep | Oct | Nov | Dec |
|---|---|---|---|---|---|---|---|---|---|---|---|---|
| 2005 | 8,229 | 8,334 | 8,411 | 8,795 | 8,683 | 8,942 | 8,642 | 8,549 | 6,580 | 6,400 | 7,811 | 8,077 |
| 2006 | 7,834 | 7,817 | 7,620 | 7,537 | 7,888 | 7,896 | 7,989 | 8,065 | 8,107 | 7,682 | 7,595 | 7,779 |
| 2007 | 7,639 | 7,358 | 7,842 | 7,724 | 7,811 | 7,938 | 8,134 | 8,100 | 7,736 | 7,711 | 7,851 | 7,949 |
| 2008 | 7,591 | 7,403 | 7,592 | 7,830 | 7,852 | 7,777 | 7,788 | 7,261 | 5,063 | 7,044 | 6,930 | 7,124 |
| 2009 | 6,790 | 6,615 | 6,932 | 7,114 | 7,030 | 7,170 | 7,043 | 7,095 | 6,991 | 6,566 | 6,651 | 6,580 |
| 2010 | 6,059 | 6,019 | 6,854 | 7,111 | 6,953 | 7,071 | 7,173 | 6,884 | 6,594 | 6,317 | 6,640 | 6,910 |
| 2011 | 6,476 | 5,743 | 6,409 | 6,321 | 6,562 | 6,552 | 6,474 | 6,709 | 6,567 | 6,335 | 6,623 | 6,546 |
| 2012 | 6,037 | 6,013 | 6,132 | 6,207 | 6,501 | 6,473 | 6,441 | 6,282 | 6,072 | 6,121 | 6,388 | 6,519 |
| 2013 | 5,964 | 5,840 | 6,089 | 6,237 | 6,631 | 6,733 | 6,847 | 6,619 | 6,583 | 6,194 | 6,527 | 6,770 |
| 2014 | 6,239 | 6,192 | 6,393 | 6,705 | 6,551 | 6,425 | 6,795 | 6,797 | 6,382 | 6,003 | 6,531 | 6,887 |
| 2015 | 6,279 | 6,235 | 6,355 | 6,532 | 6,626 | 6,551 | 6,738 | 6,743 | 6,580 | 6,504 | 6,750 | 6,751 |
| 2016 | 5,972 | 6,122 | 6,595 | 6,455 | 6,576 | 6,651 | 6,796 | 6,592 | 6,520 | 6,170 | 6,587 | 6,724 |
| 2017 | 6,253 | 6,199 | 6,466 | 6,607 | 7,023 | 6,980 | 7,041 | 6,481 | 5,595 | 6,575 | 6,942 | 7,116 |
| 2018 | 6,595 | 6,188 | 6,716 | 6,988 | 6,787 | 7,041 | 7,044 | 7,193 | 7,057 | 6,993 | 7,086 | 7,210 |
| 2019 | 6,811 | 6,520 | 6,574 | 6,712 | 6,827 | 6,972 | 6,917 | 6,939 | 6,539 | 6,270 | 6,860 | 7,035 |
| 2020 | 6,831 | 6,323 | 6,482 | 5,773 | 5,346 | 5,569 | 5,881 | 5,742 | 5,278 | 5,115 | 5,640 | 5,799 |
| 2021 | 5,763 | 4,434 | 5,477 | 6,123 | 6,389 | 6,456 | 6,337 | 6,183 | 5,557 | 5,802 | 6,205 | 6,305 |
| 2022 | 5,889 | 5,775 | 6,324 | 6,501 | 6,591 | 6,709 | 6,799 | 6,622 | 6,597 | 6,155 | 6,528 | 6,032 |
| 2023 | 6,054 | 5,939 | 6,250 | 6,480 | 6,640 | 6,490 | 6,656 | 6,445 | 6,335 | 6,093 | 6,481 | 6,744 |
| 2024 | 5,998 | |||||||||||
| - = No Data Reported; -- = Not Applicable; NA = Not Available; W = Withheld to avoid disclosure of individual company data. |
| Release Date: 3/29/2024 |
| Next Release Date: 4/30/2024 |