|
Download Data (XLS File) |
|
||||||||
|
||||||||
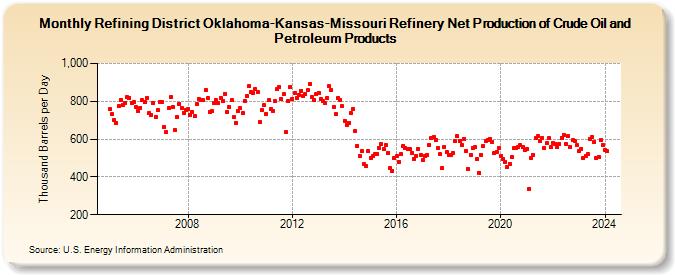
| Refining District Oklahoma-Kansas-Missouri Refinery Net Production of Crude Oil and Petroleum Products (Thousand Barrels per Day) | ||||||||
| Year | Jan | Feb | Mar | Apr | May | Jun | Jul | Aug | Sep | Oct | Nov | Dec |
|---|---|---|---|---|---|---|---|---|---|---|---|---|
| 2005 | 757 | 731 | 700 | 686 | 773 | 809 | 783 | 792 | 821 | 820 | 792 | 797 |
| 2006 | 771 | 748 | 766 | 805 | 798 | 820 | 737 | 728 | 792 | 718 | 755 | 797 |
| 2007 | 795 | 664 | 635 | 762 | 821 | 771 | 647 | 718 | 788 | 766 | 740 | 755 |
| 2008 | 759 | 729 | 745 | 720 | 784 | 811 | 808 | 805 | 861 | 815 | 744 | 747 |
| 2009 | 792 | 805 | 792 | 820 | 801 | 841 | 745 | 772 | 808 | 716 | 687 | 748 |
| 2010 | 764 | 739 | 804 | 826 | 879 | 847 | 845 | 865 | 849 | 689 | 753 | 778 |
| 2011 | 734 | 805 | 759 | 751 | 801 | 863 | 876 | 812 | 838 | 635 | 803 | 873 |
| 2012 | 814 | 843 | 819 | 835 | 857 | 828 | 838 | 858 | 892 | 823 | 806 | 837 |
| 2013 | 844 | 811 | 801 | 791 | 818 | 879 | 858 | 772 | 732 | 815 | 808 | 773 |
| 2014 | 696 | 677 | 686 | 736 | 760 | 644 | 563 | 511 | 536 | 466 | 459 | 535 |
| 2015 | 501 | 508 | 519 | 520 | 553 | 572 | 547 | 569 | 528 | 446 | 432 | 500 |
| 2016 | 509 | 481 | 519 | 566 | 552 | 550 | 546 | 528 | 495 | 512 | 548 | 516 |
| 2017 | 489 | 508 | 517 | 571 | 605 | 612 | 595 | 551 | 519 | 448 | 558 | 530 |
| 2018 | 515 | 517 | 527 | 589 | 615 | 590 | 571 | 603 | 538 | 444 | 518 | 553 |
| 2019 | 558 | 495 | 422 | 517 | 564 | 592 | 597 | 602 | 586 | 525 | 534 | 553 |
| 2020 | 512 | 497 | 480 | 454 | 469 | 505 | 551 | 553 | 557 | 568 | 556 | 541 |
| 2021 | 547 | 337 | 500 | 516 | 605 | 614 | 589 | 607 | 554 | 579 | 605 | 558 |
| 2022 | 581 | 575 | 558 | 575 | 608 | 624 | 575 | 615 | 556 | 593 | 588 | 567 |
| 2023 | 538 | 550 | 498 | 513 | 521 | 602 | 612 | 587 | 498 | 507 | 593 | 567 |
| 2024 | 542 | |||||||||||
| - = No Data Reported; -- = Not Applicable; NA = Not Available; W = Withheld to avoid disclosure of individual company data. |
| Release Date: 3/29/2024 |
| Next Release Date: 4/30/2024 |