|
Download Data (XLS File) |
|
||||||||
|
||||||||
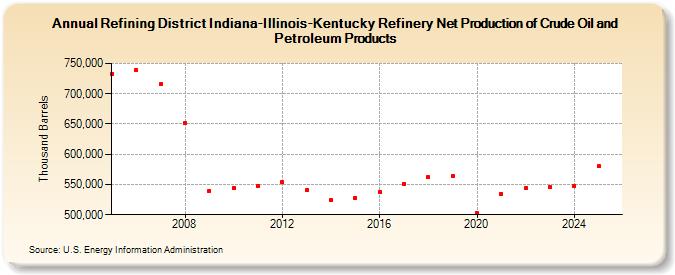
| Refining District Indiana-Illinois-Kentucky Refinery Net Production of Crude Oil and Petroleum Products (Thousand Barrels) | ||||||||
| Decade | Year-0 | Year-1 | Year-2 | Year-3 | Year-4 | Year-5 | Year-6 | Year-7 | Year-8 | Year-9 |
|---|---|---|---|---|---|---|---|---|---|---|
| 2000's | 733,431 | 738,922 | 715,515 | 651,158 | 539,170 | |||||
| 2010's | 544,610 | 547,962 | 553,566 | 540,184 | 523,826 | 528,104 | 537,721 | 551,419 | 561,698 | 564,037 |
| 2020's | 502,259 | 534,551 | 544,977 | 545,016 |
| - = No Data Reported; -- = Not Applicable; NA = Not Available; W = Withheld to avoid disclosure of individual company data. |
| Release Date: 3/29/2024 |
| Next Release Date: 8/30/2024 |