|
Download Data (XLS File) |
|
||||||||
|
||||||||
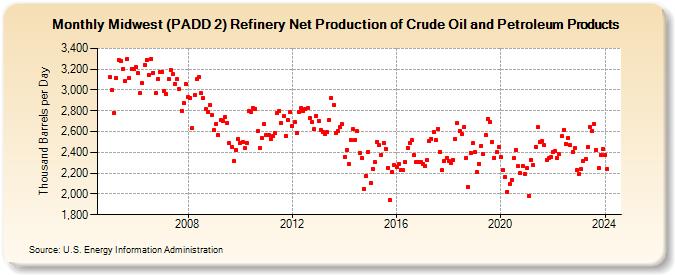
| Midwest (PADD 2) Refinery Net Production of Crude Oil and Petroleum Products (Thousand Barrels per Day) | ||||||||
| Year | Jan | Feb | Mar | Apr | May | Jun | Jul | Aug | Sep | Oct | Nov | Dec |
|---|---|---|---|---|---|---|---|---|---|---|---|---|
| 2005 | 3,122 | 2,998 | 2,776 | 3,118 | 3,291 | 3,277 | 3,201 | 3,085 | 3,297 | 3,113 | 3,204 | 3,198 |
| 2006 | 3,219 | 3,160 | 2,972 | 3,066 | 3,242 | 3,291 | 3,145 | 3,298 | 3,168 | 2,968 | 3,101 | 3,173 |
| 2007 | 3,173 | 2,991 | 2,960 | 3,103 | 3,195 | 3,151 | 3,060 | 3,103 | 3,008 | 2,802 | 2,870 | 3,055 |
| 2008 | 2,933 | 2,921 | 2,631 | 2,950 | 3,101 | 3,120 | 2,968 | 2,920 | 2,813 | 2,788 | 2,857 | 2,757 |
| 2009 | 2,613 | 2,677 | 2,563 | 2,707 | 2,705 | 2,736 | 2,680 | 2,487 | 2,456 | 2,315 | 2,424 | 2,525 |
| 2010 | 2,489 | 2,500 | 2,437 | 2,493 | 2,794 | 2,787 | 2,829 | 2,820 | 2,604 | 2,442 | 2,537 | 2,672 |
| 2011 | 2,564 | 2,564 | 2,532 | 2,558 | 2,584 | 2,782 | 2,801 | 2,684 | 2,751 | 2,562 | 2,711 | 2,787 |
| 2012 | 2,655 | 2,688 | 2,585 | 2,788 | 2,825 | 2,797 | 2,818 | 2,823 | 2,726 | 2,691 | 2,620 | 2,754 |
| 2013 | 2,705 | 2,616 | 2,594 | 2,578 | 2,591 | 2,713 | 2,924 | 2,860 | 2,584 | 2,609 | 2,641 | 2,668 |
| 2014 | 2,358 | 2,426 | 2,285 | 2,516 | 2,620 | 2,522 | 2,602 | 2,397 | 2,349 | 2,050 | 2,175 | 2,407 |
| 2015 | 2,107 | 2,239 | 2,305 | 2,503 | 2,466 | 2,375 | 2,488 | 2,435 | 2,254 | 1,941 | 2,208 | 2,275 |
| 2016 | 2,257 | 2,287 | 2,228 | 2,230 | 2,307 | 2,443 | 2,488 | 2,516 | 2,370 | 2,305 | 2,309 | 2,310 |
| 2017 | 2,289 | 2,264 | 2,323 | 2,507 | 2,533 | 2,593 | 2,517 | 2,628 | 2,402 | 2,229 | 2,315 | 2,349 |
| 2018 | 2,318 | 2,297 | 2,329 | 2,526 | 2,682 | 2,608 | 2,575 | 2,644 | 2,350 | 2,069 | 2,398 | 2,487 |
| 2019 | 2,404 | 2,213 | 2,291 | 2,463 | 2,382 | 2,567 | 2,725 | 2,694 | 2,503 | 2,350 | 2,403 | 2,452 |
| 2020 | 2,356 | 2,232 | 2,158 | 2,023 | 2,098 | 2,134 | 2,341 | 2,427 | 2,266 | 2,198 | 2,267 | 2,192 |
| 2021 | 2,247 | 1,983 | 2,328 | 2,278 | 2,455 | 2,639 | 2,499 | 2,505 | 2,467 | 2,326 | 2,343 | 2,352 |
| 2022 | 2,401 | 2,412 | 2,344 | 2,380 | 2,554 | 2,618 | 2,485 | 2,538 | 2,469 | 2,407 | 2,443 | 2,229 |
| 2023 | 2,195 | 2,239 | 2,318 | 2,337 | 2,453 | 2,646 | 2,603 | 2,676 | 2,423 | 2,245 | 2,374 | 2,428 |
| 2024 | 2,376 | |||||||||||
| - = No Data Reported; -- = Not Applicable; NA = Not Available; W = Withheld to avoid disclosure of individual company data. |
| Release Date: 3/29/2024 |
| Next Release Date: 4/30/2024 |