|
Download Data (XLS File) |
|
||||||||
|
||||||||
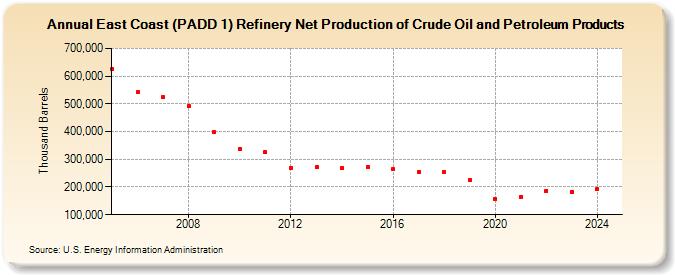
| East Coast (PADD 1) Refinery Net Production of Crude Oil and Petroleum Products (Thousand Barrels) | ||||||||
| Decade | Year-0 | Year-1 | Year-2 | Year-3 | Year-4 | Year-5 | Year-6 | Year-7 | Year-8 | Year-9 |
|---|---|---|---|---|---|---|---|---|---|---|
| 2000's | 624,403 | 540,921 | 524,541 | 492,325 | 397,200 | |||||
| 2010's | 335,538 | 324,601 | 270,115 | 270,742 | 269,427 | 271,574 | 263,290 | 255,488 | 252,981 | 225,819 |
| 2020's | 156,785 | 164,366 | 187,292 | 183,460 |
| - = No Data Reported; -- = Not Applicable; NA = Not Available; W = Withheld to avoid disclosure of individual company data. |
| Release Date: 8/30/2024 |
| Next Release Date: 8/29/2025 |