|
Download Data (XLS File) |
|
||||||||
|
||||||||
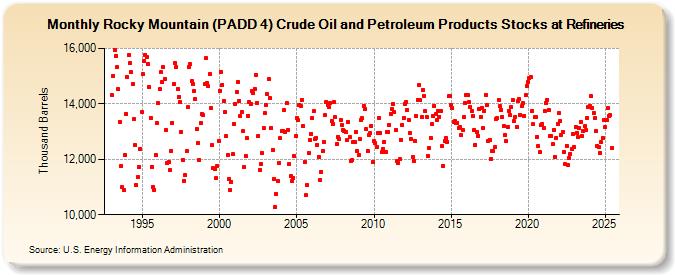
| Rocky Mountain (PADD 4) Crude Oil and Petroleum Products Stocks at Refineries (Thousand Barrels) | ||||||||
| Year | Jan | Feb | Mar | Apr | May | Jun | Jul | Aug | Sep | Oct | Nov | Dec |
|---|---|---|---|---|---|---|---|---|---|---|---|---|
| 1993 | 14,309 | 15,005 | 15,943 | 15,717 | 15,317 | 14,525 | 13,361 | 11,757 | 10,989 | 10,892 | 12,146 | 13,651 |
| 1994 | 14,965 | 15,755 | 15,458 | 15,138 | 14,712 | 13,442 | 12,506 | 11,063 | 11,374 | 11,731 | 12,388 | 13,711 |
| 1995 | 15,070 | 15,561 | 15,772 | 15,678 | 15,438 | 14,623 | 13,506 | 11,735 | 11,008 | 10,909 | 12,150 | 13,324 |
| 1996 | 14,019 | 14,519 | 15,135 | 14,786 | 15,311 | 14,899 | 13,054 | 11,851 | 11,910 | 11,617 | 12,313 | 13,318 |
| 1997 | 14,712 | 15,475 | 15,316 | 14,540 | 14,256 | 14,060 | 12,984 | 11,983 | 11,234 | 11,422 | 12,285 | 13,869 |
| 1998 | 15,323 | 15,423 | 14,806 | 14,713 | 14,464 | 14,166 | 13,089 | 12,601 | 11,975 | 13,311 | 13,634 | 13,583 |
| 1999 | 14,705 | 15,642 | 14,768 | 14,627 | 15,073 | 13,839 | 12,522 | 11,669 | 11,647 | 11,320 | 11,762 | 12,665 |
| 2000 | 14,477 | 15,162 | 14,691 | 14,116 | 13,708 | 12,822 | 12,146 | 11,285 | 10,896 | 11,188 | 12,176 | 13,284 |
| 2001 | 14,009 | 14,442 | 14,800 | 14,109 | 13,566 | 13,712 | 13,015 | 11,720 | 12,122 | 12,766 | 13,576 | 14,063 |
| 2002 | 14,006 | 14,468 | 14,378 | 14,545 | 15,054 | 14,042 | 12,850 | 11,612 | 11,826 | 12,235 | 13,114 | 13,653 |
| 2003 | 13,957 | 14,339 | 14,880 | 14,196 | 13,145 | 12,340 | 11,298 | 10,267 | 10,743 | 11,225 | 11,878 | 12,760 |
| 2004 | 13,017 | 13,020 | 13,795 | 13,001 | 14,015 | 13,054 | 11,819 | 11,381 | 11,216 | 11,322 | 12,109 | 12,836 |
| 2005 | 13,501 | 13,405 | 13,975 | 13,915 | 14,156 | 13,193 | 11,901 | 10,694 | 11,067 | 12,231 | 12,690 | 12,923 |
| 2006 | 13,481 | 13,729 | 12,724 | 12,769 | 12,517 | 12,095 | 11,251 | 11,552 | 12,296 | 12,634 | 13,582 | 14,084 |
| 2007 | 13,955 | 13,881 | 14,025 | 13,391 | 13,277 | 14,066 | 13,509 | 12,556 | 12,814 | 12,718 | 13,433 | 13,223 |
| 2008 | 13,062 | 13,024 | 12,986 | 12,689 | 13,350 | 12,799 | 11,948 | 11,969 | 12,636 | 12,627 | 12,981 | 12,312 |
| 2009 | 12,150 | 12,725 | 13,414 | 13,471 | 13,936 | 13,831 | 13,080 | 12,302 | 12,866 | 12,933 | 13,201 | 11,895 |
| 2010 | 12,644 | 12,573 | 12,447 | 12,946 | 13,487 | 12,954 | 12,245 | 12,364 | 12,639 | 12,264 | 12,975 | 12,982 |
| 2011 | 13,247 | 13,627 | 13,801 | 13,999 | 13,694 | 13,072 | 11,928 | 11,872 | 11,997 | 12,705 | 13,254 | 13,487 |
| 2012 | 13,991 | 14,073 | 13,780 | 13,420 | 12,955 | 12,719 | 12,089 | 11,951 | 12,664 | 13,554 | 14,153 | 14,679 |
| 2013 | 14,123 | 13,520 | 14,493 | 14,299 | 13,738 | 13,535 | 12,115 | 12,405 | 12,770 | 13,257 | 13,546 | 13,937 |
| 2014 | 13,619 | 13,400 | 13,732 | 13,538 | 13,757 | 12,475 | 11,760 | 12,656 | 12,766 | 12,637 | 14,271 | 14,274 |
| 2015 | 13,944 | 13,845 | 13,359 | 13,373 | 13,319 | 13,324 | 13,132 | 13,162 | 12,879 | 13,058 | 13,525 | 14,038 |
| 2016 | 14,319 | 14,308 | 14,049 | 13,877 | 13,747 | 13,570 | 13,061 | 12,529 | 12,982 | 12,850 | 13,825 | 13,542 |
| 2017 | 13,865 | 13,125 | 13,753 | 14,336 | 13,941 | 12,668 | 12,712 | 12,022 | 12,284 | 12,290 | 12,434 | 13,455 |
| 2018 | 13,474 | 14,149 | 13,907 | 13,776 | 13,519 | 13,203 | 12,870 | 12,658 | 13,163 | 13,750 | 13,585 | 13,872 |
| 2019 | 14,137 | 13,363 | 13,519 | 13,175 | 14,091 | 14,178 | 13,605 | 13,911 | 14,016 | 13,575 | 14,303 | 14,642 |
| 2020 | 14,782 | 14,938 | 14,962 | 13,753 | 13,259 | 13,522 | 13,539 | 12,815 | 12,467 | 12,249 | 13,221 | 13,283 |
| 2021 | 13,136 | 13,750 | 14,035 | 14,140 | 13,795 | 12,850 | 12,839 | 12,550 | 13,073 | 12,091 | 12,778 | 13,283 |
| 2022 | 13,670 | 13,387 | 12,883 | 12,989 | 12,268 | 11,816 | 12,492 | 11,796 | 12,046 | 12,197 | 12,385 | 12,900 |
| 2023 | 12,446 | 13,175 | 12,969 | 12,792 | 13,121 | 13,262 | 12,856 | 13,025 | 13,189 | 13,057 | 13,578 | 13,893 |
| 2024 | 13,931 | |||||||||||
| - = No Data Reported; -- = Not Applicable; NA = Not Available; W = Withheld to avoid disclosure of individual company data. |
| Release Date: 3/29/2024 |
| Next Release Date: 4/30/2024 |